For pretty much everyone on the planet, 2020 was a year unlike any other, from the craziness of the US election, through to the changes to our routines that the early days of the COVID-19 pandemic imposed on us. And for the web analytics and marketing community, there was another significant disruption: the launch of Google Analytics 4 (GA4).
Though we didn’t know it at the time, this new product would spark a major shift within organizations to transition to the platform before it’s too late. Google announced in March 2022 that Universal Analytics, used by millions of websites worldwide, would be retired in 2023 and that organizations that were using must migrate to GA4 to continue collecting web analytics data.
But what is GA4, and why do we even need the change? In this article, we’ll explore these questions so you can be ready when the deadline arrives. To be able to understand why Google made the decision to effectively replace Universal Analytics with GA4, we need to take a trip down memory lane.
Google Analytics: A Brief History
Cast your mind back (if you dare!) to a time when phones had buttons, where MSN messenger had over 220 million active monthly users, and when only half your friends actually had the internet, and of those who did, a majority of them used dial-up connectivity (Australian Bureau of Statistics, 2004-05). If you are not old (or Tasmanian) enough to remember what dial-up internet is, I will not do you the disservice of traumatising you; all you need to know is that this world I speak of was very different to now.
The year is 2005, when a company called Urchin Software Corporation sold their software, called Urchin Analytics, to Google. Even though Urchin initially developed this technology in early 1995, it offered what was considered the highest level of web analytics reporting available at the time. It was a significant improvement for organisations who, prior to this, had to get their IT teams to export server logs, whereupon they would hand-analyse them.
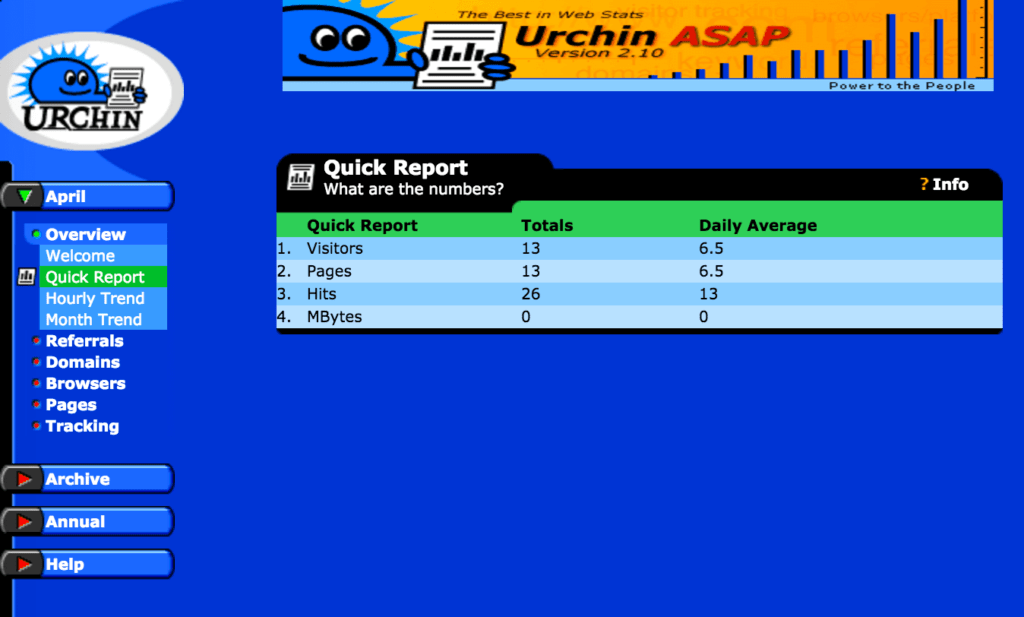
Looking at a dashboard from a pre-Google acquisition version of Urchin, many of the reports we use in Universal Analytics today were already there. In fact, until GA4, Google Analytics had an unbroken lineage to Urchin. For example, UTM tags have been helping Google Analytics understand how someone arrived on your site for a long time. The UTM prefix stands for “Urchin Tracking Module”, and this is a direct remnant of the Urchin platform. In fact, the Google still hosts the support documentation from Urchin (here’s a link, if you’re interested)!
All this is to say that Google Analytics has a long history, much of which has been around since before Google acquired it. And to add to this legacy, the web as a platform has changed beneath it. Urchin, as well as the early versions of Google Analytics (known as Classic Analytics) and the current version (called Universal Analytics), were built for a different web; a web where phones were used for snake and SMS, not searching and streaming, as they are today.
The Web Has Changed
Fast forward to 2022, and our world is a technological marvel, with a wide range of internet-connected devices, from smartphones to computers, wearables, and IoT devices to smart home systems – and that’s just the tip of the iceberg! By the end of 2022, there will be around 13.1 billion IoT devices worldwide, many of which can be used to access the web via a browser, such as on a smart TV, fridge, or watch, and can also download and install apps.
This has caused a shift in the mindset of many users, with a greater expectation that websites will behave in a native app-like way.
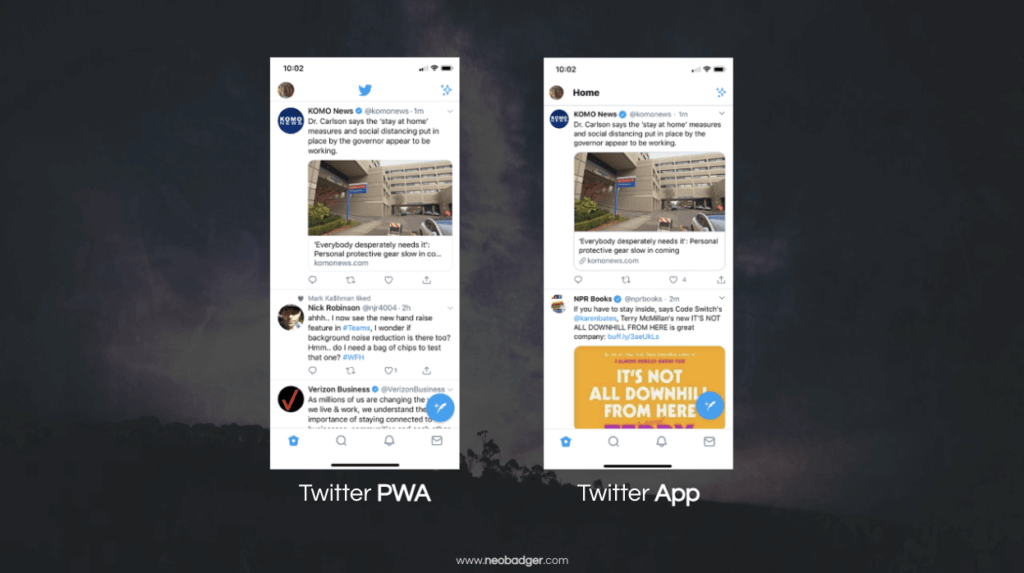
Take a look at Twitter, for instance. For those of you reading this article in a future where Elon Musk has caused the complete collapse of this platform, you can read about what Twitter was. Their web and app experiences are almost identical. They can even be downloaded as a PWA, which is a feature that is particularly valuable for emerging internet markets such as India, Africa, and regional parts of the US and Australia.
Indeed, I tested the Uber PWA against the native app on my low-end test phone for a month. As a heavy Uber user (since I don’t drive, and find myself craving burgers fare more often than I am prepared to admit), I found the PWA not only felt like a more seamless native experience, which was more familiar to the device I was using, but it was also faster and didn’t consume as much battery. And it’s not just Twitter and Uber. The likes of Yummly, the Financial Times, Target, Starbucks, and Tinder have moved to a web app mode, and I can understand why.
Not only are web apps less resource-intensive and expensive to maintain and develop, they also have a more ubiquitous accessibility surface, allowing them to be used on any device with a browser that supports PWAs (and that is over 96% of internet users). And with this merger of experiences between web and app, and the expectations of users demanding more from websites in kind, so the need for a new way to understand this behavioural shift emerges.
Nowadays, it’s common for people to switch devices while using the internet. In fact, about 80% of consumers do it while engaged in an activity, and around 40% of online transactions involve multiple device switches. It’s clear to see that we are living in a world where referring to the internet as an information resource is not too dissimilar to checking your watch as you go about your day. But this is a world that — up until recently, at least — Google Analytics was simply not built for.
How has Google Responded?
The web of the last 20(ish) years was built on the premise that a user navigates from one page to another in order to consume content and undertake their desired actions. But nowadays, so many of a user’s interactions can occur within a single page — from adding and removing items from the cart, to loading new articles on the fly on a blog — and it’s this shift that Google has built BY DESIGN into Google Analytics 4.
And this brings us to our first point.
New Measurement Model
The Universal Analytics (or GA3) data model was based on the traditional “page to page” model, described above. It later incorporated the concept of “Events” to track actions that take place between pages, such as clicks on buttons, links, video views, and other passive actions like scroll depth.
GA4 simplifies the measurement model by treating every action as an event, rather than categorising them into page views, product events, and custom events. The advantage of this event-based model is that we can easily add more information to our data by including additional context using parameters (more on this below) with the event. This is more reflective of the modern web experience and is also context-agnostic.
Context-Agnostic Reporting
Context-agnosticism in human language means we can track websites and native apps using the same approach. This is especially useful when tracking websites that behave like apps, as described earlier in the Twitter and Uber examples.
To achieve this, GA4 introduces the concept of Streams, which (as the name suggests) are streams of data collected from an organisation’s websites, native apps, and other digital properties. Google allows multiple data streams to be set up per property, and all the data can be reported on in the same place. This is beneficial for organisations that need a macro view of their customer touchpoints, as it provides insight into how users interact with their various properties and how they fit into the overall customer journey.
As a result of unifying data sources with Streams, Google had to refactor their data model. This was necessary to accommodate different definitions used to describe different data between an app and a website, particularly when there is an equivalence between an action (such as a page view and an app screen view).
Built For Extensibility
One of the most powerful aspects of GA4 is the ability that administrators have to extend and customise the default data collection model. Because all actions are events in GA4, we can make use of parameters to ship custom data along with that supplied by Google.
To understand parameters, think back to when you set up an event in Universal Analytics: you would provide values for the Category, Action, and Label fields to understand the event and its context. In Google Analytics 4, we can do exactly the same but for any event, and you are not limited to 3 parameters. You can send up to 25 parameters per event, each with a namespace and value of your choosing, and you can send them along with pretty much any event you wish.
The significance of this is that we can now guarantee our web analytics data meets the reporting requirements of the business, instead of being limited to Google’s one-size-fits-all approach. Even if you don’t go to the extent of manually setting up events and customising them, Google Analytics 4 ships with a feature called ‘Enhanced Measurement’ which tracks a bunch of events on your site without any need for manual tagging.
Simply put, by adding the Google Analytics 4 snippet to your site, Google can track the following events with no additional code or event tracking:
- Page views (with the ability to activate history state change tracking, very good for PWAs).
- Scrolls to 90% of the page
- Outbound clicks
- Site search
- Video engagement (play, progress, and completion events)
- File downloads
- Form start and submit
This is a game-changer for smaller organizations that may not have access to a technical marketer or agency to help them track core interactions on their site. However, Enhanced Measurement is not perfect and may not work out of the box for all websites (e.g. if you submit your site searches or contact forms using AJAX).
Enrichment with AI and ML
It is no surprise that Google is leveraging its Artificial Intelligence and Machine Learning tools in one of its most used products. In GA4, we can make the most of this through anomaly detection. Anomaly detection, although not traditionally ML or AI, can identify uncharacteristic peaks and troughs in time-series data by applying a Bayesian state-space time-series model. This allows for faster detection of noteworthy changes in your data, which Google highlights directly in your reports.
In addition, Google uses a heuristic model to backfill data that might otherwise be unavailable (due to degraded access to browser APIs and storage). This is how Google has been able to reduce the number of Cookies set by GA4, when compared to Universal Analytics.
By far the most visible manifestation of ML in GA4 is the insights panel (accessible from the main dashboard and through the smart search), whereby Google will surface points of interest based on your data. Users can also query their data using natural language (such as “which pages have the highest engagement rate on mobile?”, and GA4 will run the query and return the result.
Google Signals
In addition to the above measures to maintain data integrity in a cookieless world, Google has introduced Google Signals. Through the use of Google Signals, we can access the plethora of session data from sites and apps that logged-in Google users (i.e. someone with an @gmail.com account) access. Users must have Ad Personalisation enabled to be part of this data cohort; most users have it enabled.
Google Signals unlocks a number of features that were not accessible in Universal Analytics, including:
Cross Platform Reporting: when a user starts the path to undertaking a conversion action on your website but switches (a common occurrence, as described above), you are able to leverage Google Signals data to unify sessions between devices.
This works across Android and iOS devices (though not after iOS14), and users who are logged into their Google account in browsers such as Edge and Chrome, irrespective of device. Note that you will need a monthly average of 500 users per day to unlock Signals data.
This is a big step for web analytics as it has always been a challenge to truly report on users; Google might call them ‘Users’ in their platforms but really they are an identifier associated with a browser. Google Signals allows us to get closer to a truly user-centric collection model (much as you can with User-IDs in your website or app).
Remarketing Audiences: the use of Google Signals unlocks the ability to create remarketing audiences directly in Google Analytics. When you link your Google Ads or other Google Marketing Platform advertising products (such as DV360), you are able to serve ads to these audiences, with cross-device continuity.
Demographic and Interest Reporting: Google allows access to aggregated demographic and interests data from users who are signed in to their Google accounts and who have turned on Ads Personalization.
Privacy First Data Collection
With more and more regulatory intervention governing how organisations can collect and manage user data (particularly in Europe and several states in the US, with the GDPR and the CCPA, respectively), user privacy is at the forefront of GA4. As much as it is ultimately the responsibility of organisations to respect users’ privacy preferences, it was high time that Google responded in kind.
Data Retention: Google’s Data retention options give you control over how long GA4 stores user-specific data. The default time period is two months, but you can choose to extend it to 14 months if needed. It’s important to note that this does not limit your access to data to only the past 14 months. Instead, it means that user-specific data will no longer be retained after the specified time period has passed (more on this point below).
Data Deletion: administrators can now efficiently act upon data deletion requests raised by their users. This is a convenient and secure way for users to manage their personal data and ensures that their information is only stored by the organisation with the consent of the user, a consent that can be retroactively withdrawn, as per the requirements of the GDPR.
IP Address Anonymisation: it is now possible to remove the last octet of an IP address, preventing the retrieval of high-resolution location data. This can be undertaken at a collection level, with a simple API interface to do so:
gtag('config', 'G-P0T4TO3S', {
  'anonymize_ip': true
})
There are some limitations to this feature as it relates to GDPR compliance (read more in my article ‘Is Google Analytics GDPR Compliant?’), however, there are ways to manage this with Server-side tagging.
Granularity Controls for Location & Device: administrators of GA4 can now manage the granularity of location and device data at a regional level, such as Germany, Australia, or even Antarctica. This tool is powerful, as it enables organisations to manage region-specific preferences, thus improving their ability to meet their privacy commitments.
Ads Personalisation Exclusions: prior to this feature, you could only opt users in or out of Google’s Ads Personalisation. However, like the Location and Device controls, you can now opt users out on a regional basis. This is important if the use of Google Signals data is considered to be inappropriate for a particular region.
Keep in mind that whilst the above features might help organisations to meet user privacy commitments, it is important to recognise that it is ultimately your responsibility to put mechanisms in place to preserve your users’ right to privacy.
Powerful In-platform Reporting
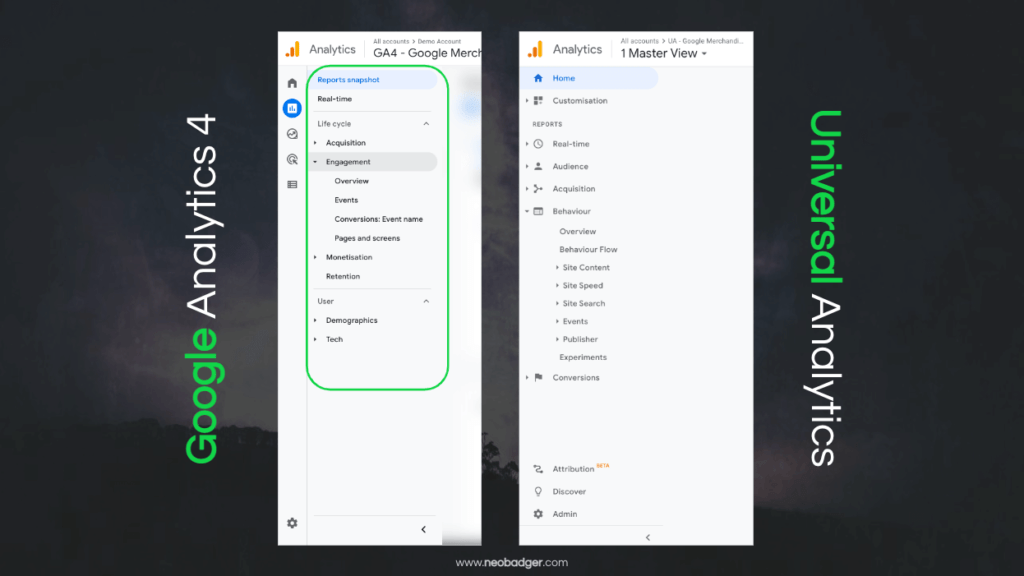
At some point, you will want to actually look at all of your shiny new data, and Google has really stepped up their reporting capabilities in GA4. In keeping with the theme of empowering organisations to customise GA4 to their needs, Google has actually reduced the number of aggregate reports that you can view on the platform itself.
Fewer reports? How is this a good thing? The main reason that Google simplified their default aggregate reports was that many in the analytics community said that they simply didn’t use them; they didn’t reflect their organisation’s reporting needs. This lack of familiar reports is one of the main reasons people feel a bit lost in GA4.
Indeed, I have undertaken training sessions with 6 digital marketing and web development agencies and, when polled, 92% of attendees stated that they don’t use GA4 by default because they can’t find the data they need quickly, citing an unfamiliar UI. I think this is quite a fair feeling, especially given that agencies often need to make decisions on the fly, with limited time.
Google has supplied two different solutions for reporting in GA4, both have different applications, and can be customised extensively. Both solutions offer valuable insights into your web and app data, and in most cases, the data will be the same in both solutions. However, there may be instances where the data shown in each section differs.
Explore Reports: this report type enables you to analyse raw event and user-level data in great detail. It is similar to exporting the data directly from the source; every row of data is included and is subject to your processing. You are able to query up to 10 million events (and up to 1 billion if you use Google Marketing Platform) without the constraints of sampling.
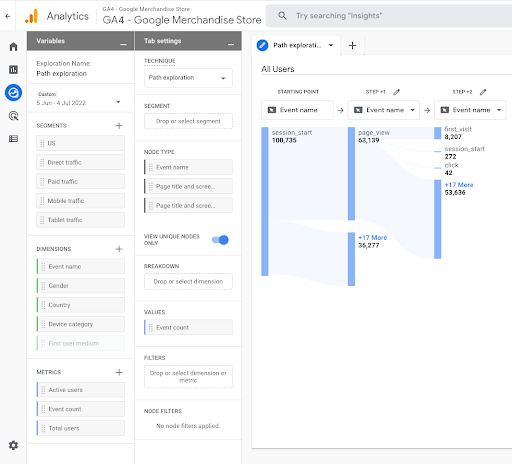
You can access these reports through the side panel in the GA4 user interface (under ‘Explore’) which can be thought of as a combination of using the Google Analytics Reporting API, along with Looker Studio or PowerBI.
Aggregate Reports: this report type, on the other hand, reports on aggregated data up to 50 thousand rows (or 2 million when applying a secondary dimension or comparison). As such Aggregate reports are useful for getting a snapshot of performance at a high level, particularly if you have lower cardinality data (under the aforementioned row limits).
These reports are accessible through the side panel in the GA4 user interface (under ‘Reports’) and are the equivalent of the reports you are used to seeing in Universal Analytics.
Both reports are useful and have their pros and cons. For instance, the Explore reports tend to be more accurate and yield higher-definition data than Aggregate reports, however, you are confined to your data retention window (up to 14 months on a free Google Analytics account).
Integrations Galore
Now, this heading really needs a caveat, as the integrations we are speaking about here are exclusive to Google’s product base. With that said, the integrations that are now available are a significant quality-of-life improvement for power users of Google Analytics and its data.
Naturally, you can still connect your Google Ads and Search console accounts to GA4 (among other integrations), however, the big call out is the addition of Google BigQuery, which allows administrators to effectively warehouse data at a high granularity beyond the data retention window (as discussed above), should their privacy policy and governing laws allow them to.
Comparing GA3 vs GA4 Data
So how do all of these updated data collection and reporting features stack up to Universal Analytics, and how do they affect the data? Many people will set up GA4, let it run for a month or so, and then start comparing the data collected against their Universal Analytics data, only to find that things are different or completely missing.
Having a solid understanding of which dimensions and metrics are different between the two platforms, and how to understand and project this delta is critical for a smooth transition, especially if you and your organisation rely on data over an extended timeframe (such as time-series data comparing multiple years in your reports).
The reality is that there are limitations to how much you can compare metrics between Universal Analytics and GA4, largely due to the change in the data model. Let’s take a look at what has changed and how.
Users
You will be familiar with Total Users and New Users from Universal Analytics. However, GA4 introduces an additional metric into the mix: Active Users. This new addition is the primary user metric in GA4 (i.e. whenever you see Users in your aggregate reports, you are looking at this metric), whereas Universal Analytics reported on Total Users as its primary user metric.
So what is the Active User metric and how is it calculated? It is simply the number of users who has an engaged session (there are some other events that qualify a user as ‘Active’, however, I will omit these for brevity; you can read more on these here).
This brings us to another new metric, though we will touch on it in passing for now. An Engaged Session is the number of sessions that lasted 10 seconds (though you can increase this threshold in settings) or longer, or had 1 or more conversion events, or 2 or more page or screen views.
The important thing to remember here is that Universal Analytics reports on Total Users (shown as Users) by default in its reports, whereas GA4 reports on Active Users. If you are comparing the two, you will need to expect your GA4 user totals to be lower than Universal Analytics. The totals might be close to parity if you have highly engaged users visiting your site.
Sessions
Universal Analytics and GA4 handle the session metric similarly; for example, both will abide by the session timeout rules applied to your account (the default is 30 minutes). However, there are some small changes Google has made to the session metric that, depending on the nature of your traffic, may have a significant impact on your data.
Universal Analytics will restart a user’s session at midnight, whereas GA4 does not. This means that if you have a user who arrived on your site at 11:58 pm and finished browsing at 12:02 am, Universal Analytics will record this user as having two sessions, whereas GA4 will only record one.
Whilst this may appear to be an uncommon situation, it is more common than you think, particularly if you have multiple websites serving different regions (with different timezones) that all feed data into a single Google Analytics property (such as in a roll-up account structure). Even if all your users are in a single timezone, there are circumstances that cause this quirk to come into play (such as product drops during sales events, as with Black Friday, or ticket or event sales).
In addition, GA4 will not restart a user’s session when new campaign parameters are encountered, whereas Universal Analytics will. As an example, if a user arrives on your site after clicking a Facebook Ad (which has been UTM tagged) and creates an account, whereupon a verification email is sent to them (which has also been UTM tagged), Universal Analytics will record this user as having two sessions, whereas GA4 will only record one.
Google has also updated their session validation and processing window for late hits (e.g. a page view or other events which are sent some time after the action has occurred). Universal Analytics will process hits if they arrive within 4 hours of the end of the previous day (before 11:59 PM on the preceding day), whereas, GA4 will process hits up to 72 hours later. As an example, if you have a user who starts browsing your site at 11.50 pm and then loses network service (if they are on an aeroplane) mid way through their session, and then regains access 48 hours later, GA4 will process those hits, whereas Universal Analytics will ignore them.
This can mean that your Session count will be higher in GA4 than what you might see in Universal Analytics, as the late hits are simply lost in Universal Analytics. The increased processing window in GA4 may also result in different Session counts, depending on when you query your data. For instance, if you look at data from the 5th and 6th of January on the 7th of January, there may be fewer sessions than if you look at the same date range on the 15th of January. This is because the first time you queried your data was still within the 72-hour window, whereas the second time all the sessions would have been counted.
Another big factor is the use of Google’s statistical estimation models, which are used to approximate how many sessions occurred on your site or app as a means to backfill lost data. This is something that Universal Analytics does not do, and it is applied when your data is processed (meaning you can not influence the estimation directly, other than to modify your session controls and instrumentation).
The important thing to note here is that the differences in how sessions are calculated will impact not just the Session metric in isolation, but might impact reports which use the Session metric as a calculated predicate (for instance, when you are looking at the Landing Page dimension). It is likely that Universal Analytics will report a higher number of sessions than GA4 if any of the above scenarios affect your organisation.
Conversions
Conversions are what we have been calling Goals in universal Analytics, however, this is not where the differences between the two end. There are a number of differences between Universal Analytics and GA4 definitions which may make it challenging to compare the two.
When there are two Goals of the same type in a single session, Universal Analytics will record just a single goal (essentially reporting on a unique count, with cardinality being defined to the session instance itself). GA4, on the other hand, counts multiple conversions per session, even if the conversion is the same.
This means that if you have a newsletter form and a contact form, both of which lead to the same thank-you page, and a user completes both in the same session, Universal Analytics will record this session as having one Goal, whereas GA4 will record two Conversions.
This is maybe a big change for some organisations, particularly if your users undertake more than one of your conversion actions per session. If they do, then expect your GA4 conversion count to be higher than your Universal Analytics goal count.
Bounce rate
You might have read that Bounce Rate is not actually a metric in GA4, and whilst it was retrievable through the Reporting API, it was not actually accessible in the GA4 user interface; that is, until fairly recently. We can now see it in our Aggregated Reports and Explore reports, and it looks similar to what we are used to seeing in Universal Analytics. There are, however, changes to how it is calculated under the hood. We have spoken about the updated engagement-centric model Google is using to qualify sessions and engaged users, and this very much comes into play with Bounce Rate.
In GA4, Bounce Rate is simply the percentage of sessions that were not engaged. In simple terms, it is the opposite of Engagement Rate, which compares Engaged Sessions against the total number of sessions for a given period. This is different from what we are used to seeing in Universal Analytics because the old Bounce Rate was the number of sessions that only viewed one page and no subsequent hits (in the form of another page view or event) were sent to the Analytics server.
The reason for this change was driven by the page-to-page versus single-page model we discussed earlier; websites offer a more app-like experience, with more actions possible on a single page. In fact, Progressive Web Apps (PWAs) are essentially single-page websites that use JavaScript to manage routing and display different content.
In addition, it provides a more practical way for websites that offer more transactional content (such as blogs with recipes, how-to content, or news publications), where a user might arrive on the site from a search engine, review the content (often on a single page) and then go back to the search engine for additional supporting content).
Remember that your Bounce Rate may appear lower in GA4 when compared to Universal Analytics, especially if you have engaged users. This is because we use an engagement-centric model to evaluate Bounce Rate, instead of the old method of assuming sessions with only a single page view event and no other events are not engaged, when they may actually be.
Should you Make The Switch?
Many organizations have been somewhat strong-armed into making a decision sooner rather than later, following Google’s announcement that standard Universal Analytics properties would no longer collect data after July 1, 2022 (and paid 360 properties a year later). And if your organization relies on legacy data (e.g year-on-year comparisons, or long-running time series data), then you risk losing your data if you don’t implement a data warehousing plan, as Google will be completely retiring access to Universal Analytics in July of 2024.
Regardless of the type of Universal Analytics account you have, and when your ‘end of life’ deadline is, you have a limited amount of time to decide if you want to use GA4 or a different web analytics vendor. Even those with a 360 Universal Analytics account should have a clear idea and game plan by now.
If you have the luxury or freedom to explore other options, now is a very good time to do so. Keep in mind that it’s your organisation’s reporting needs that should drive the decision of where you source your data from (i.e Google Analytics vs Adobe Analytics), and not the other way around.
This disruption, while inconvenient, is a good opportunity to review how your organisation uses web analytics data. I speak to many people who say they are following the same reporting scheme they have used for years, either out of convenience or because those they report to are accustomed to seeing a specific type of report.
If this sounds familiar, ask yourself these questions:
- are these reports helping our organisation improve the experience for our end users?
- does the data truly reflect the questions I/our organisation have?
- what is our signal-to-noise ratio in our report content (i.e how much legacy or ‘filler’ data is there in our reports that serves no clear purpose)?
The answers to these questions should help clarify if Google Analytics is still the right fit for your organisation, or if you should investigate another option, such as Mixpanel or Heap. In many cases, Google Analytics will still be the best option, even for the sake of reporting continuity, and so a robust plan for your transition from Universal Analytics to GA4 is very important.
Final Thoughts
The switch from Universal Analytics to Google Analytics 4 has brought about a number of changes, from the data that is collected and how it is reported on, to how the data is rendered in the reporting UI. It is important to understand these changes and how they may affect the data you are seeing, especially if you are relying on long-term data comparisons (where you might be drawing upon data from both Universal Analytics and GA4).
When considering the switch to GA4, it is important to keep your organisation’s reporting needs at the forfont, and to review the reports you are using to ensure they are helping you improve the experience for your end users. It is also important to consider other web analytics solutions, such as Mixpanel or Heap, to see if they provide more relevent data, or manage it in a way that is more aligned to your users’ privacy expectations.
Whilst the transition may seem daunting, understanding the nuances of GA4 and how it differs from Universal Analytics will help you make a smooth transition.