Imagine having the immense power of the Google Analytics API at your fingertips, but with the added flexibility and ease of use that comes with Google Spreadsheets. That’s precisely what the Google Analytics Spreadsheet add-on brings to the table. The Google Analytics Spreadsheet Add-on is a tool that allows you to access, visualize, and analyze your Google Analytics data directly from Google Sheets.
This tool can be a game-changer for organizations of all sizes, as it allows you to skip the step of exporting data from Google Analytics and importing it into a spreadsheet for further analysis. If you are a data hungry, Google Analytics power user (or just want to be more productive), this is your Swiss Army Knife for Google Analytics; It has a range of features, like the ability to query and report data from multiple views (which will put a smile on your face if you have roll-up reports), run custom calculations (great for incorporating business logic into your reporting), and even run scheduled actions.

And you can do all of this (and more) form the comfort of your spreadsheet; no slow Google Analytics UI and having to reconfigure all your filters every time you want to do an export. It’s your data, without any of the overhead. Nifty, right? Without further frothing, lets got into how to install and use this beast.
Getting Started: Installing the Add-on
Alright, let’s roll up our sleeves and get this add-on installed. It’s as simple as creating or opening a Google Sheets Spreadsheet and opening the Extensions menu in the top navigation. From there, go to Add-ons and then click on Get Add-ons, and a modal will pop up where you can search for Google Analytics.
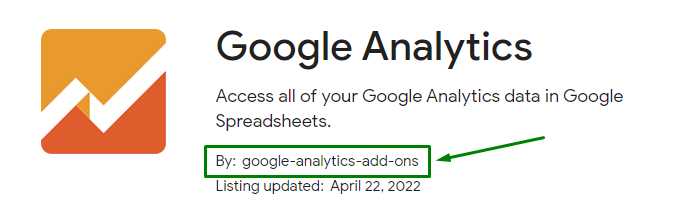
An important note before installing any addons is to make sure it was published by the organization/person you are expecting, in our case Google, as you are giving the add-on permission to access and export form your Google Analytics account, and these are permissions you don’t want in the wrong hands. You can check this by looking at the ‘By’ designation, and in our case, we want to see ‘google-analytics-add-ons’ here.
Once you have confirmed you have the right extension, click install and grant the required permissions, and you are all set. Note that you might only have one ‘Install’ button and that is fine; I used a paid Google Workspace account above and this is why I have the option for Admdin vs Individual install. Here’s all of these steps in action:
You will likely be prompted to allow the sheet (you have open) access to the add-on, in which case you can simply click the affirmative button (OK, Confirm, or Continue – I have seen all three here). With that, we are now ready for the really fun part: orchestrating the report settings.
Creating Your Report Configuration
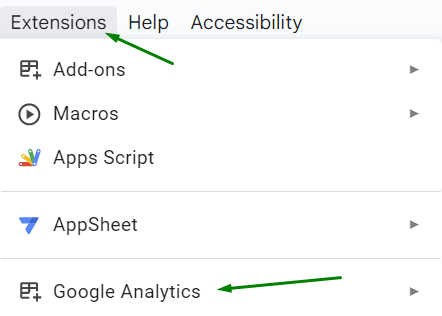
Our add-on that we just installed will live under the Extensions menu. In this step, we are going to create a new report (i.e. data import to your sheet). To get thing started, we need to open the configuration UI, and this can be opened in Extensions menu in the top navigation, and at the bottom of the drop down, you should see an add-on called Google Analytics.
A submenu will pop-out and you will be met with an array of options, and in our case, we want to select Create new report. When you click this, the configuration UI will open on the right-side of your sheet, and this will get all the core settings ready for our import.
To kick things off, you need to give your report a name. Keep in mind that you might have multiple reports, each of which has a discreet configuration, so choose a name that describes the data you are importing (unlike what I have done in the above video). Later on, we will see that this configuration gets added to our sheet and we can easily update it (if we know what the report is for).
Next up, selecting your account, property, and view. These should match the name of the Google Analytics accounts you have access to with the Google account you are signed into Google Sheets with. If you don’t see them there, you can either switch accounts (which will require you to reinstall the add-on) or grant the account you are logged into permission to access your account.
Finally, select your Metrics, Dimensions and any Segments you wish to include in your sheet and click Create Report, and configuration settings will be automatically created in your sheet.
Note that this is not importing the data just yet; what has been created are all the parameters needed to facilitate a import, but none of the data has actually been requested just yet. We are almost at this stage, but we have one last round of tweaks to make and then we can get that juicy data.
Running Your First Import
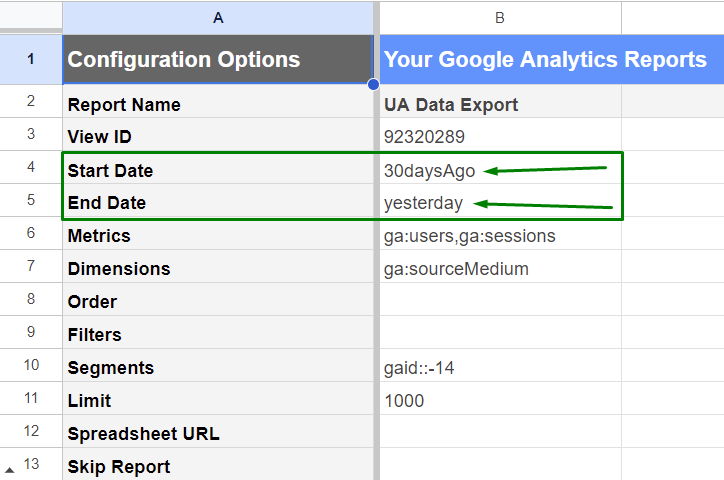
The content in your sheet is the panel that will let you fine-tune your import settings. By default, the date range is set to the last 30 days, but you can totally change that here. You can use the good ol’ YYYY-MM-DD format, or just type in ‘today’, ‘yesterday’, or ‘x-daysAgo’ (where X represents a number).
Now for the filters – you can use them just like you do in Google Analytics. For instance, if you want to see only data from the US, just type in ga:country==United States into the Filters row. Similarly, you can add -ga:sessions to the Order row.
Now, you might be wondering why each metric or dimension has a ‘ga:’ infornt of it. This is the syntax used by the Google Analytics Core Reporting API (catchy name), and the beauty of this is that you don’t need to go through the reporting UI to modify these after you have created your report. Here is a reference you can use to find the references you are looking for.
With all that done, we are ready to actually run our report. Navigate to our trusty Extensions navigation item, open up the Google Analytics submenu, and click Run report and watch the magic happen!
Once completed, a new sheet tab with the name of your report will be added to the bottom of your Sheets workspace. In it, you will find all the data you added to your reporting config. Now, at this point you should be sipping your tea with an air of superiority (and rightfully so), as you have just used the Core Reporting API to extract your data into Google Sheets, and you didn’t even have to open Google Analytics!
One important consideration that often gets overlooked when it comes to Google Analytics data and this is sampling. This occurs when your query returns a large number of rows (in Google Analytics, not in Google Sheets), and instead of trying to retrieve the whole lot, Google Analytics will retrieve a sample. This can occur with complex queries or queries that include a broard date range.
You can see if sampling is occurring in your import but navigating to the tab that was created when your data was imported, and looking at the Contains Sampled Data row:
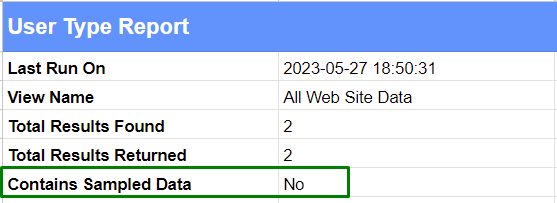
At the risk of describing the obvious, when your data is sampled, it will say Yes and if not, it will say No. If you’re using the free version of Google Analytics, Google starts getting picky with this sampling business once you hit the 500k mark on sessions within your report’s timeframe, and paid GMP accounts will hit the same issue at 1 million.
So what actually happens when Google gets picky with the sampling? It’s quite simple. The figures in your report then start being based on this smaller subset of data. So, in essence, you’re getting the gist of your data landscape, but remember, it’s just a sip, not the full cup of tea!
Scheduling Reports to Run Automatically
One of my favorite features of this tool is the ability to schedule reports to run automatically. The beauty of this feature is that you can ensure you data is always fresh, which is useful if you are using your sheets import as a data source for a reporting tool like LookerStudio or PowerBI.
To get started – you guessed it – navigate to the Extensions menu in the top navigation, and then to the Google Analytics add-on. In the submenu for the add-on, you will see Schedule reports, and clicking it will open a configuration modal what will allow you to set a frequency and a schedule.
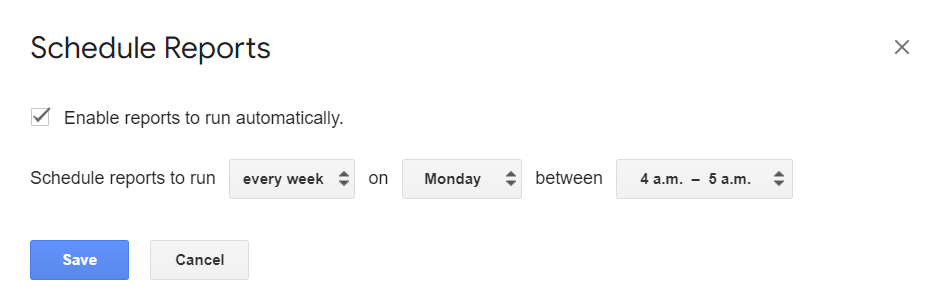
Once saved, Google Sheets will run your query at your selected interval. Note that the time zone used for the query is governed by that in your Google Sheets settings, so keep this in mind when working with a Google Analytics account that might be in a different time zone.
Final Thoughts
Alright, tech enthusiasts, that’s a wrap! You’ve now seen firsthand the impressive abilities of the Google Analytics Spreadsheet add-on. I mean, look at it! It’s more than just a tool; it’s a digital powerhouse that lets you dissect and manage your Google Analytics data like never before, right within your Google Sheets. Say goodbye to the cumbersome import/export waltz and endless tussles with the Google Analytics interface, and say hello to hassle-free, on-demand data.
Yet, what’s genuinely thrilling is that we’ve only just begun to explore what this add-on can do. With some creativity, a sprinkle of effort, and your insatiable appetite for data exploration, you’re set to create reports that’ll leave your colleagues in awe, asking, “Wait, how’d you pull that off?”
Yes, like everything else in life, this tool isn’t without its flaws. But let’s look at the bright side: it paves the way to a world of powerful functionalities that would otherwise require multiple tedious steps. At the very least, it frees up some valuable time for you to shine up your favorite apple, enjoy a leisurely cup of tea, or indulge in whatever else keeps your metaphorical guineapig tickled. So, why wait? Give it a shot and enjoy your new data importing journey!