There’s a weekly ritual for anyone who manages or reports on a marketing budget, a moment of truth that often feels more like a moment of confusion. It’s the ceremonial lining up of the browser tabs—your ad platforms, your analytics, your sales dashboard—each promising a clear window into your performance.
In Tab A, your Facebook Ads Manager is glowing, proudly proclaiming you scored 100 shiny new conversions last week. Permission granted to celebrate with a piping hot cup of tea and a muffin! In Tab B, Google Analytics offers a more… reserved perspective. It cautiously suggests you got about 60 conversions. Okay, a bit of a buzzkill, but your ego is still intact. Then you click over to Tab C, your Shopify or CRM dashboard. The cold, hard truth. It slaps you hard in the face like a cold, soggy teabag: 45 conversions.
Your heart sinks. Suddenly, that tea and the muffin seem so far away. Your brain starts to fizz. Who is lying to you? Is the whole system broken? Is this finally proof that the Illuminati is real and is conspiring against you? Did you forget to carry the one somewhere in your tracking setup? You start questioning everything. Your career. Your life choices. Whether you should have just opened that guinea pig sanctuary in the Huon Valley like you always dreamed of.

Take a deep breath. You’re not crazy, and your tracking probably isn’t as busted as you think. The truth is, all three of those numbers are, from a certain point of view, “correct.” They’re just answering entirely different questions. This whole mess isn’t about finding the one true number; it’s about understanding why these platforms see the world through different lenses. And once you understand their perspectives, you can stop pulling your hair out and start making genuinely smart decisions.
This is the digital marketer’s paradox: we are drowning in data, yet starved for a single, simple truth. In this article, we’re going to unravel this knot. We’ll dive deep into the murky waters of attribution models, explore the technical quirks that cause these discrepancies, and, most importantly, give you a practical framework for using these conflicting reports to build a stronger, more profitable marketing strategy.
Are you ready? I can’t hear you, I said: ARE YOU READY? Hmm, perhaps you are on mute or something… Though I will admit, expecting a two-way dialogue, through an article, is a little unconventional… If you did just yell “YES” in front of all your colleagues, now might be the time to take the rest of the day off before HR “invites” you to.
Let’s get into it.
Part 1: It’s All About Who Gets the Credit
At the heart of this numerical chaos is a concept called “attribution” which regular readers will know is something of a favourite topic of mine. As a refresher, let’s forget marketing for a second and think about the last significant journey you took. Not just popping down to the shops (unless, like me, you live a long way form civilisation), but a proper, multi-stage odyssey. You might have taken a taxi to the airport, walked a travelator to the terminal, caught a plane to a new country, jumped on a bus that connected to a boat, which finally arrived at a dock where a camel was waiting to take you that last mile to your glamping tent.
So, when you’re telling the story later, who gets the credit for getting you there?
Was it the camel that handled the final, dusty half-mile? He was important, sure, and probably deserves an extra carrot for his efforts, but giving him all the credit seems a bit much, especially considering his questionable attitude. Or does the praise go to the taxi driver who kicked the whole thing off hours, or even days, before? She surely deserves a tip, right?

In marketing, your channels are the itinerary and your destination is the conversion—a sale, a lead, or a sign-up. Attribution is the messy process of deciding which part of that journey gets the credit for the final success. And here’s the kicker: every platform involved has its own opinion, its own ego, and its own way of handing out the gold stars. The airline, the bus company, and the camel’s owner are all, in essence, the heroes of their own travel story.
This is where the divergence begins. So, let’s break down the main players in your marketing journey and their self-serving worldviews.
Facebook & Google Ads: The Eager Cheerleaders
Let’s be brutally honest: ad platforms are the cheerleaders for their own team. Their entire business model is built on convincing you that their platform is the main character of your marketing story. Using our travel analogy, they are the airline, and their job is to persuade you that the flight—not the taxi, the boat, or the grumpy camel—was the most important part of the holiday. To do this, they design their attribution to cast a very, very wide net.
This generosity is useful for getting a feel for your general influence, but it can also lead to them taking credit for a conversion they merely whispered about from across the room. They generally report on two main pathways to a conversion:
- “Click-Through” Conversions: This one is clean and simple. Someone clicks your ad and then buys something within a set timeframe. It’s the equivalent of someone clicking the “Book Now” button on the airline’s pop-up ad. No arguments there.
- “View-Through” Conversions: This is where things get a bit squiffy. Someone sees your ad, doesn’t click it, but then wanders over to your site later and converts. The ad platform still raises its hand. It’s like seeing a billboard for an airline on Tuesday and then booking a flight with them on Thursday. Did the billboard cause the sale? Or was it one of a dozen other factors? The platform will always vote for the billboard.
Facebook is the master of this. Right now, its default setting is 7-day click and 1-day view. This means it will take credit for a sale if someone clicks your ad and converts within a week, OR if they just see your ad and convert within 24 hours.
This wasn’t always the case. In the ancient, pre-2021 history of digital marketing, Meta used a whopping 28-day click window. Then Apple’s infamous iOS 14.5 privacy update came along and basically turned off the tracking lights, forcing Meta to shorten its default windows. Just to keep things interesting here in 2025 (as if things weren’t interesting enough), they’ve recently brought back the 28-day click number, but only as a comparison column in your reports. You can look at it for old times’ sake, but you can’t use it to actually optimise your campaigns.
To muddy the waters even further, platforms are now inventing new ways to claim credit. You’ll see terms like “interactions,” which is a vague catch-all that might mean a click on one ad format but just a passive view on another. Meta has also rolled out “engaged-view” attribution for its video ads. This means if someone watches your video for at least 10 seconds (or almost all of it if it’s a short one) and then converts within a day, they’ll count that, too.
What this all boils down to is that the ad platform is asking a very different, and much more forgiving, question than you are. You’re asking, “What caused this sale?” They’re asking, “Did we, you know, plausibly have anything at all to do with it, and perhaps get you to increase your budget, and even buy some shares in our company while you’re at it”? That difference in perspective is everything.
Google Analytics: The Meticulous Historian
Google Analytics (especially GA4) tries to be a more neutral party. It’s like the meticulous historian of your website, sitting in the corner with a notebook, trying to document every visitor’s complete journey. It isn’t beholden to any single ad platform (theoretically, at least), so its goal is to show you how all the different channels work together.
Historically, Universal Analytics defaulted to a “last non-direct click” model. This meant that whichever channel sent the visitor to your site right before they converted got 100% of the credit, unless that final visit was from them typing your URL directly into their browser. It was simple, but it was like giving all the credit for your holiday to the camel. It ignored 19 hour flight where you had to endure a screaming baby, turbulence, and 3 back to back Jason Statham movies.
GA4, the new standard, has evolved. It defaults to a “Data-Driven Attribution” (DDA) model. This is a much more sophisticated approach. DDA uses machine learning to analyse all the different touchpoints in both converting and non-converting user paths. It then assigns a fractional credit to each touchpoint based on how much it likely contributed to the final decision (which is why you see fractions rather than integers in your reports). It’s like saying the taxi driver gets 40% of the credit, the baby who threw up on the snoring lady on the plane gets 30%, the camel gets 20%, and I would be remiss if I didn’t give Jason Statham at least 10%, even if it’s for simply attempting a single multi-sybalic phrase in a movie. It’s a more holistic and, frankly, more realistic view of the world.
However, GA is primarily session-based. It tracks visits. A single user can have multiple sessions from multiple sources over time. Its main purpose is to answer the question: “How did all of our marketing channels work together to produce this outcome?” It’s comparative, not absolute.
CRM & E-commerce Platforms: The Unforgiving Accountant
Finally, you have your CRM or e-commerce platform. This is your source of truth. The accountant. The security guard at the airport. It has zero interest in who gets the credit, what the user journey looked like, or how many times someone saw an ad. It cares about one thing and one thing only: did a transaction successfully occur?
When an order is processed in Shopify, or a lead form is submitted and enters Salesforce, that’s a hard, undeniable event. It’s recorded in a database. Money changed hands. An email was collected. There’s no ambiguity. These platforms record the what, not the why or the how. They are the definitive record of what actually happened on the business end.
The number in your CRM or Shopify backend is the number you report to your CFO. It’s the number you pay taxes on. But it provides almost no context about the customer’s journey. It might record a referral source if it was passed through correctly on the final click, but it has no visibility into the Facebook ad they saw three weeks ago or the blog post they read last Tuesday. Its job is to answer the question: “How many sales did we actually make?”.
So, right off the bat, we have three different systems with three different motivations, all trying to measure the same thing. Is it any wonder the numbers don’t match? It’s like asking a poet, a philosopher, and a physicist to describe a sunset. You’re going to get three very different, yet equally valid, descriptions.
Part 2: Where the Numbers Really Go Off the Rails
Okay, so we’ve established the philosophical differences. The ad platforms are egotistical cheerleaders, Analytics is the thoughtful historian, and your CRM is the no-nonsense accountant. But the chasm between their numbers is widened by a series of technical hurdles and limitations that are, frankly, a massive headache. This is where the real nitty-gritty of the discrepancy lies.
Let’s pull back the curtain on the messy machinery running behind the scenes.
Tracking Methodologies: Pixels, Sessions, and Cold Hard Cash
The very way these systems collect data is fundamentally different. It’s like trying to measure the length of a coastline with a yardstick, a satellite, and by walking it. The results are bound to differ.
Platforms like Meta and Google Ads rely on a piece of code called a “pixel” (or “tag”) that you place on your website. This pixel acts as their spy on the ground. When a user who has recently interacted with one of their ads visits your site, the pixel fires and sends information back to the mothership: “Hey, that gal you showed an ad to? She’s on the checkout page!” Post-iOS 14, this has become more complicated.
For Apple users who opt out of tracking, platforms now rely on APIs like Meta’s Conversions API (CAPI) and Google’s Enhanced Conversions, which send data from your server directly to theirs. This is more reliable than a browser-based pixel, but it’s still an estimate. Crucially, these platforms have also started heavily relying on modelled conversions. When they can’t see the full picture due to privacy restrictions, their algorithms make an educated guess to fill in the blanks. These are statistically probable conversions, not necessarily confirmed events. This is a huge source of over-reporting.
As we touched on, GA thinks in terms of “sessions” or visits (though there are ways to make it more user-oriented). When a user lands on your site, a session begins. GA then tries to attribute everything that happens within that session (and connect it to previous sessions) to a traffic source. If a user clicks a Google Ad, GA starts a session and attributes it to “google / cpc.” If that same user leaves and comes back an hour later by clicking an organic search result, that’s a new session attributed to “google / organic.” GA’s job is to stitch these sessions together into a coherent user journey. It’s a much more complex and user-centric view than the ad platform’s event-based model.
Your Shopify or Salesforce backend doesn’t care about pixels or sessions. It records a transaction when its own internal criteria are met. An order is created in the database with a timestamp and a total value. A new contact is created from a form submission. This is server-side reality. It’s not an estimate or a model; it’s a log of an actual event that happened on your server. This is why it’s considered the “source of truth” for what happened, but it’s blind to the journey that led there.
The War of the Attribution Windows
This is one of the biggest and most misunderstood drivers of discrepancy. An attribution window (or lookback window) is the period of time after a user interacts with an ad during which a conversion can be credited to that ad. And guess what? Every platform has a different default window.
Let’s walk through a common scenario. Meet Rivka.
- Monday (Day 1): Rivka is scrolling through Instagram on her phone and sees your ad for a cool Tasmanian-made ceramic mug. She clicks it, browses your site for a minute, but gets distracted and leaves.
- Wednesday (Day 3): Rivka remembers your mugs and searches on her laptop for “handmade Tasmanian ceramic mugs.” She clicks on your Google Search Ad, adds a mug to her cart, but decides to think about it.
- Friday (Day 5): Rivka finally makes up her mind. She types your website URL directly into her browser and completes the purchase.
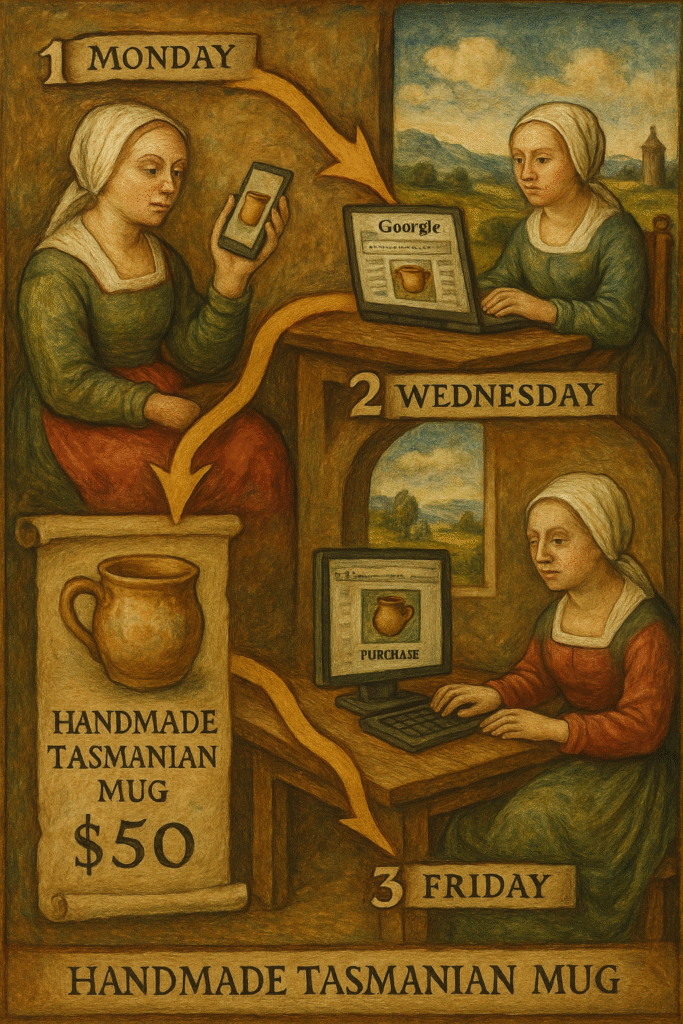
Now, who gets the credit for this $50 sale?
- Facebook Ads (7-day click window): Rivka clicked an ad on Monday and converted on Friday (4 days later). Since this is within the 7-day window, Facebook triumphantly claims 1 conversion.
- Google Ads (30-day click window): Rivka clicked a Google Ad on Wednesday and converted on Friday (2 days later). This is well within the default 30-day window, so Google Ads also claims 1 conversion.
- Google Analytics (Last non-direct click model): The last touchpoint before the direct visit was the Google Ad. So, GA attributes 1 conversion to Google Ads. If it were using a data-driven model, it might give, say, 70% to Google Ads and 30% to Facebook.
- Shopify: It records 1 sale of $50. It might note the final traffic source as “Direct,” completely missing the ad interactions.
So for one actual sale, you now have three different reports: Facebook shows one, Google Ads shows one, and your final sales log shows one. In this simple case, it seems okay, but what if Jane had only seen the Facebook ad and not clicked it? Facebook might still claim a view-through conversion, while everyone else would attribute it to Google Ads. You can see how this quickly balloons. You end up with your ad platforms collectively claiming far more conversions than actually occurred in your store. It’s not that they’re lying; they’re both just taking credit for the same sale based on their own rules.
The Cross-Device Conundrum and the Privacy Gauntlet
Wait, actually, it gets even more complicated. The modern customer journey is a chaotic mess that spans multiple devices, browsers, and apps. The scenario with Jane assumed a perfect world, but what if she saw the Instagram ad on her iPhone, did the Google search on her work PC (which blocks cookies), and finally bought on her personal MacBook?
This is the cross-device tracking nightmare. How do you know that’s the same person?
Ad Platforms are pretty good at this. Why? Because you are logged into your Google or Facebook account on all those devices. They can connect your activity on your phone to your activity on your laptop through your user ID. They have a massive advantage here, creating a more persistent identity graph. A study by the IAB suggests that over 65% of online purchases in the U.S. involve more than one device, highlighting how critical this is.
Google Analytics struggles more. By default, GA uses anonymous client IDs stored in browser cookies. The cookie on Jane’s iPhone is different from the cookie on her MacBook. To GA, they look like two different people. You can enable a feature called Google Signals, which uses data from logged-in Google users to help de-duplicate, but it’s not perfect and only works for a subset of your traffic.
Your CRM/Shopify has no idea. It only knows that a purchase was made.
And then there’s the privacy gauntlet. This is the big one. In recent years, a wave of privacy-centric changes have fundamentally broken old-school tracking models.
- iOS 14.5 and App Tracking Transparency (ATT): In 2021, Apple dropped a bomb on the digital advertising world. They started requiring apps to ask users for permission to track them across other apps and websites. Unsurprisingly, most people said no. Estimates suggest that global opt-in rates are hovering around 25%. This kneecapped Facebook’s ability to see what users were doing after they left the app, forcing them to rely on aggregated, delayed, and modelled data from Apple’s SKAdNetwork framework. The signal was severely weakened.
- Ad Blockers & Browser Privacy: A significant chunk of the population uses ad blockers. The global ad blocking rate in early 2024 was estimated to be around 42.7%. Browsers like Safari (with Intelligent Tracking Prevention) and Firefox (with Enhanced Tracking Protection) are now actively blocking third-party tracking cookies by default.
All of this to say, there are ever-growing black holes in your data. Conversions are happening that your pixels and tags simply cannot see. This is why platforms are leaning so heavily on “modelled conversions”—using AI to fill in the gaps. It’s a necessary adaptation, but it also introduces another layer of estimation and potential discrepancy between the optimistic models of the ad platforms and the hard-and-fast reality of your backend sales data. You’re no longer just comparing apples and oranges; you’re comparing apples, modelled oranges, and the ghost of a Brussels sprout.
Part 3: So… Which Number Is Actually “Right”?
After all that, you’re probably wondering if you should just throw your computer out the window, move to that off-grid cabin in Tasmania, and communicate exclusively via carrier pigeon. It feels like an impossible question. If Facebook says 100, GA says 60, and Shopify says 45, which number do you put in your report to your boss?
Here’s the liberating, if slightly unsatisfying, answer: None of them are “right” in isolation. And all of them are useful.
Chasing perfect alignment between these platforms is a fool’s errand. It’s like trying to get a painter, a sculptor, and a musician to create the exact same piece of art. They use different tools, different mediums, and have different goals. The moment you stop trying to force them into a single, unified number and start appreciating them for their unique perspectives is the moment you unlock their true power.
The key is to reframe the question. Instead of asking “Which number is right?”, you should be asking, “What question is each platform answering?”
Ad Platforms (Facebook/Google Ads) are Directional
The numbers in your ad platforms are your directional compass. They are telling you about momentum and influence. They are designed to answer questions like:
Is my advertising spend generating demand for my product? Is this particular campaign or ad creative resonating with my target audience? Which audience segments are most responsive to my messaging?
When you see 100 conversions in your Facebook Ads Manager, you shouldn’t interpret that as “Facebook single-handedly generated 100 sales.” You should interpret it as, “Our activity on Facebook influenced a set of outcomes that, according to Facebook’s measurement, is equivalent to about 100 conversions.” It’s a measure of influence.
Use this number to optimise your campaigns. If Campaign A is showing a higher ROAS (Return On Ad Spend) than Campaign B within the platform, it’s a strong signal that you should allocate more budget to Campaign A. The absolute numbers are inflated, but the relative difference between them is incredibly valuable for making tactical decisions. It’s like using a compass that’s off by 10 degrees. It might not point to true north, but you can still use it to travel in a consistent direction.
Google Analytics is Comparative and Holistic
Google Analytics is your strategic map of the entire battlefield. It shows you how all your different platoons—paid search, social, organic, email, direct—are working together. It answers the bigger, more strategic questions:
What role does each channel play in the overall customer journey? How do users who arrive via organic search behave differently from those who arrive via paid social? What are the most common conversion paths my customers take?
The 60 conversions GA reports are a more conservative measure, designed to show you how channels interact. Using the data-driven attribution model in GA4, you can see that maybe paid social is great for introducing new customers (it gets a lot of credit for first touches), while paid search is excellent at closing the deal (it gets credit for last touches).
This is the data you use for high-level budget allocation and channel strategy. It helps you understand the symbiotic relationship between your efforts. Maybe you see that a big push on Facebook ads leads to a subsequent rise in branded organic search traffic. GA is the tool that connects those dots. It’s less about the absolute number and more about the interplay and the percentages.
CRM/E-commerce Platform is Definitive and Financial
This is your bottom line. Your source of truth. The number here is not directional or comparative; it is definitive. It answers the most important questions for the business:
How much revenue did we actually generate? How many new leads did we acquire? What is our actual, undeniable profit and loss?
The 45 conversions in your Shopify backend are the ground truth. This is the number that finance cares about. It’s the number that determines your inventory, your cash flow, and your company’s health. It is completely devoid of marketing context, and that is its strength. It is pure, unadulterated business performance.
You use this number to measure the overall health of your business. It is the ultimate success metric against which all your marketing efforts are judged. While the ad platforms tell you about the wind, and GA tells you about the currents, your CRM tells you exactly how far your ship has actually travelled.
So, who is “right”? They all are. They’re just speaking different languages. Your job as a savvy marketer isn’t to be a translator trying to find a one-to-one word match. Your job is to be an interpreter who understands the nuance and meaning behind what each one is saying.
Part 4: Practical Takeaways for the Overwhelmed Marketer
Alright, theory is great. But you’re sitting there with your spreadsheets open, and your boss wants a report by the end of the day. What do you do? How do you move from a state of chronic confusion to one of confident action?
This is where the rubber meets the road. It’s time to stop agonising and start strategising. Here’s a practical, no-nonsense guide to managing this multi-platform reality.
1. Radical Acceptance: Stop Chasing the Ghost of Parity
First things first: accept that the numbers will never, ever match perfectly. Ever. Let go of that dream. It’s a ghost. Chasing it will only lead to wasted hours, endless frustration, and circular conversations with your agency or stakeholders.

Your goal is not to achieve perfect 1:1 alignment. Your goal is to build a coherent and intelligent narrative from multiple, flawed data sources. The sooner you embrace the mantra “consistent trends over absolute numbers”, the better your mental health will be.
Have this conversation with your stakeholders. Set expectations upfront. Create a “reporting philosophy” document that explains why the numbers differ and how you will be using each source. Managing expectations is half the battle.
2. Use Each Tool for Its G-d-Given Strength
Don’t try to use a screwdriver to hammer a nail. It’s inefficient and you’ll probably hurt yourself. Apply the same logic to your reporting tools.
- Inside the Ad Platforms (Facebook, Google, LinkedIn, etc.): This is your cockpit for in-flight optimisation. Use the platform-reported conversions (inflated as they may be) to make decisions within that platform. Is Ad Creative A outperforming Ad Creative B? Is the “Lookalike 1%” audience driving a better Cost Per Conversion than the “Interests” audience? These platforms provide the fastest feedback loop for tactical changes. Optimise your campaigns using their data.
- Inside Google Analytics: This is your control tower for channel-mix strategy. Use GA to understand the bigger picture. Are you investing too much in bottom-of-funnel channels and neglecting top-of-funnel awareness? How does your email marketing support your paid social efforts? Use GA’s attribution and pathing reports to inform your quarterly and annual budget allocation. It helps you see the forest, not just the trees.
- Inside your CRM/E-commerce Platform: This is your bank statement. Use it to measure your ultimate business KPIs. What is your actual revenue? What is your Customer Acquisition Cost (CAC) when calculated against total marketing spend and actual new customers? What is your Lifetime Value (LTV)? This is the data you report to your board and use to calculate profitability.
3. Align Your Settings Where You Can
While you’ll never get perfect parity, you can at least make sure you’re not comparing apples to apple-sized watermelons. Do a quick audit of your attribution settings across platforms to bring them into closer, more logical alignment.
- Attribution Windows: Check the attribution windows in Google Ads, Facebook Ads, and any other platforms you use. If Google is on a 30-day click and Facebook is on a 7-day click, be aware of that difference when comparing their performance. You can often customise these settings. While you can’t make them identical, choosing similar windows (e.g., setting everything to a 7-day click) can reduce some of the discrepancy.
- GA4 Attribution Model: Ensure your Google Analytics 4 property is set to the reporting attribution model that makes the most sense for your business. For most, the default Data-Driven Attribution is the smartest (and, depending on your analytics platform, the only) choice. But understand what it’s telling you versus an old-school Last Click model. In your GA4 settings, you can actually compare models side-by-side, which is a powerful way to see how credit shifts depending on the lens you use.
4. Build a Blended, Multi-Source Dashboard
The holy grail here is not to find one perfect tool, but to combine them into a single, unified view. This is where dashboarding tools like Google’s Looker Studio, Tableau, or Power BI become your best friend. Create a master marketing dashboard that pulls data from multiple sources via their APIs:
- Top Section: The Executive Summary (from your CRM/Shopify)
- Total Revenue
- Total Leads/New Customers
- Overall Blended CAC (Total Marketing Spend / Total New Customers)
- This is the ground truth. It’s what the business ultimately achieved.
- Middle Section: Channel Performance Analysis (from Google Analytics)
- Sessions and users by channel.
- Assisted conversions by channel.
- Breakdown of conversion credit by channel using GA’s attribution model.
- This shows how you achieved the results in the top section.
- Bottom Section: Platform-Specific Diagnostics (from the Ad Platforms)
- Spend, Impressions, Clicks, and CPM from Google Ads and Facebook Ads.
- In-platform ROAS or Cost Per Conversion.
- This section tells you about the health and efficiency of your tactical efforts.
By structuring your reporting this way, you tell a complete story. You lead with the definitive business outcome, explain the strategic channel mix that drove it, and then provide the tactical platform metrics that show operational efficiency. It preempts the question of “Why don’t the numbers match?” by framing each data source in its proper context from the outset.
5. Focus on Trends, Not Absolutes
This is the most crucial mindset shift. Stop obsessing over the fact that Facebook reported 105 conversions last week while Shopify reported 68. Instead, look at the trends week-over-week.
Did you increase your Facebook budget by 20%, and did Shopify revenue also increase by a correlated amount, say 10-15%? Even if the absolute conversion numbers are miles apart, the positive correlation is a strong signal that your investment is working. Plot the spend from your ad platforms on one axis and the actual revenue from your CRM on another. If the lines generally move up and down together, you’re on the right track. This “correlation over attribution” approach is often a far more practical and stress-free way to measure the impact of channels that are notoriously difficult to track directly.
Final Thoughts
So, we come full circle, back to those three warring browser tabs. The frustration you felt is valid. It’s born from a desire for clarity and certainty in a world that is inherently messy and uncertain. For years, the digital marketing industry sold a promise of perfect, one-to-one tracking that was never truly real and is now, in the age of privacy, definitively a thing of the past. The good news is, you don’t need that mythical perfection to be a brilliant marketer.
The differences in your conversion counts are not a sign of broken tracking; they are a feature, not a bug. They are the natural result of different systems with different philosophies, methodologies, and goals, all trying to make sense of a chaotic human journey. Your Facebook Ads Manager is your optimistic scout, looking for signs of influence on the horizon. Your Google Analytics is the cartographer, mapping the complex terrain and the various routes travellers take. And your Shopify dashboard is the treasury, counting the gold that actually made it into the fortress.

You will never get them to agree on a single, identical story. But by listening to all of them, you can interpret their unique perspectives, triangulate the truth, and make far more intelligent decisions. You can learn to trust the directional signals from your ad platforms to optimise your campaigns, use the holistic view from Analytics to refine your channel strategy, and anchor it all to the undeniable, bottom-line reality of your CRM.
So, the next time you see those conflicting numbers, don’t panic. Don’t blame the pixel. Instead, take a sip of your tea, and appreciate the rich, multi-faceted story the data is trying to tell you. Your real job isn’t to make the numbers match. It’s to lead—to grow the business, to drive profit, and to build a brand people love. And for that, you need insight, not just identical integers. Now, go review your attribution settings, have a calm chat with your stakeholders, and start reporting on what truly matters.