Analytics Advisor: Plain English Questions, Fine Print Answers
It is a quarter past eleven on a Monday night, and you have just typed a question into a little box in the top-right corner of Google Analytics. Not a filter. Not a regular expression. A question, in English, the way you would ask a colleague: "Why did sales drop last week?"
Seven seconds later, the box answers. It has a chart. It has a percentage. It has a cause, stated with the calm of someone reading a train timetable: revenue fell 18%, mostly because organic search sessions were down, and here is a suggestion for what to do about it.
This is wonderful. You screenshot it. You paste it into the leadership channel with a short, professional note. By Tuesday morning the head of marketing has booked a meeting about the SEO agency. By Tuesday lunchtime the SEO agency has booked a meeting about the head of marketing. By Wednesday someone has proposed a "search recovery taskforce", which will meet fortnightly in the big room with the good biscuits, and a board paper is being drafted with the phrase "structural decline in discoverability" in bold.
On Thursday, somebody opens the actual report.
Revenue was down, yes. But "last week" in the answer ran on Pacific time, because that is the time zone the property was set up with in 2021 by someone who has since left. The organic drop was mostly a pile of sessions that GA4 had filed as "Unassigned" after a newsletter went out without its campaign tags. And two of the days were still processing when you asked, so the numbers were not finished yet.
Nobody lied. Nothing was broken. The answer was a perfectly fluent sentence built on a report that had several warning lights on, and the sentence left the warning lights behind.
Put the kettle on and sit back down. The assistant is not the problem, and it is not useless. It is new. On 12 December 2025, Google announced the launch of Analytics Advisor, "an agentic conversational AI assistant, powered by Gemini models", inside the Google Analytics interface. And Google's own help page says, in plain words, that "in some scenarios, Analytics Advisor may not generate responses that are accurate or relevant". That is not a scandal. It is a fair warning, and it leaves the checking to you.
So here is the plan. First, what Google actually shipped, from its own dated pages, and what it has not told us. Then we go under the floorboards: what happens between an English question and a GA4 report, where the choices hide, and which warning flags the report carries that a sentence can drop. Then five checks you can run on any AI-generated GA4 answer, each one taken down to the mechanism that causes it. Then a made-up cider vinegar maker in Cygnet spends a week checking the assistant's homework, so you can see the whole routine end to end.
Let's get into it.
Part 1: What Google Actually Shipped
Let's start with what we can confirm, because a post about checking AI answers that made things up about the AI would be a special kind of embarrassing.
Google first showed the Advisor at Google Marketing Live in May 2025. On 12 November, Dan Taylor, Google's Vice President of Global Ads, announced on The Keyword that Ads Advisor and Analytics Advisor, "two agents using the latest Gemini models", would come to English-language accounts in December, for both GA Standard and Google Analytics 360 properties. The official account was, let's say, enthusiastic:
THIS JUST IN — Analytics Advisor is here 🗣️
Analytics Advisor uses conversational AI to deliver faster answers, root cause analysis, and optimized growth strategies right in Google Analytics.
Ask a question and get immediate answers — complete with visualizations, helpful links, and guided tours.
It's your built-in data consultant in Google Analytics. Available in December! 👇 https://goo.gle/3LYiPnK
— Google Analytics (@googleanalytics), 12 November 2025 on X
Then, on 12 December, the GA4 release notes recorded the launch. You reach it through a persistent icon in the top-right corner, or through the Google Analytics Search box. According to the release note, it can surface high-level insights, draw visualisations for specific metrics and events, diagnose "sudden drops or spikes", and answer "how-to" questions about features and property configuration.1
What the help page says, which is the part worth reading twice
The Analytics Advisor help page, as it stood in December 2025, is short and unusually candid. Four lines matter for this article:
- Advisor "processes data solely at the property level". It sees the property you are in, and nothing else. Unless that data is already in the property, it does not see your CRM, your Shopify admin, or the spreadsheet where the finance team keeps the real numbers.
- It is available in properties with English as the selected language, with plans for more languages.
- It "may not generate responses that are accurate or relevant". You can rate each answer with a thumbs up or thumbs down.
- It "reflects information that is available in Google Analytics".
That last line is the whole article in eight words. The Advisor's answer can be only as right as the GA4 data under it. If a report is thresholded, sampled, rolled into an (other) row, full of Unassigned traffic, or still processing, the Advisor is working from that same report. It does not have a secret, cleaner copy of your data somewhere.2
The help page groups example questions into themes: "generic data questions" ("How is my website doing?"), "fully specified questions" ("Trend of active users over the last 30 days"), "why" questions ("Why did my total revenue drop on August 1st?"), "how to" questions, reading property configuration ("What is my measurement ID?") and optimisation. Google's blog post adds that for a broad question, "it infers relevant reports". And for a "why" question, it "performs a key driver analysis, identifying and attributing the reasons for spikes or drops".
"It infers relevant reports." Read that phrase slowly, because it is the hinge of everything that follows.
What Google has not told us
As of December 2025, Google has not published how the Advisor turns a question into a report: which reports or API calls it uses, how it picks a date range when you say "last week", or whether it passes on the warnings that a report carries. So I will not tell you how it works inside. I do not know, and nor does anyone outside Google who is being honest about it.
What I can tell you is how GA4 reports work, what choices any report must make, and which warnings each report carries. Those are documented in detail. And that is enough to check any answer, from the Advisor or from any other AI tool pointed at your GA4 data, because every tool that reads GA4's reports or its Data API is working from the same reports.
Part 2: Under the Floorboards, From a Question to a Report
You already know how this works with people, even if you have never thought about it.
Say you walk over to the analyst's desk and ask, "How did we do last week?" A good analyst does not answer. A good analyst asks you four questions back. Did you mean revenue, or orders, or visitors? Last week as in Monday to Sunday, or the last seven days? Compared to what, the week before or the same week last year? And do you mean everyone, or just the Australian store?
Most of us find this slightly annoying. It is also the most useful thing the analyst will do all day. Each of those questions is a choice that changes the answer, and the analyst is refusing to make it for you in silence.
A report is a question with every choice written down
In GA4, every report makes those choices explicitly. It has to, because the database cannot read your mind. A report is built from four kinds of choice:
- Metrics: the numbers. Total revenue, sessions, active users.
- Dimensions: the things you split the numbers by. Channel, country, page.
- A date range: the start and end dates, in a particular time zone.
- Filters and comparisons: which rows count, and what you are comparing against.
When you build a report by hand, you pick each one, and you can see what you picked. When you ask a question in English, somebody or something else has to pick them for you. Google's phrase for this, again, is that the Advisor "infers relevant reports". A choice is still made. You just do not see it being made.
How a machine writes the same choices down
To see what an explicit choice looks like, look at the Google Analytics Data API, the interface that programs use to ask GA4 for reports. A request names its metrics (totalRevenue), its dimensions (sessionDefaultChannelGroup) and its date ranges. A date range can be written as fixed dates, or as words: 7daysAgo, yesterday, today. The documentation says those words are resolved "based on the property's reporting time zone".
Here is a small worked example of why that matters. The property's reporting time zone is set in Admin, when someone creates the property. If your property was created with US Pacific time, "yesterday" is Pacific yesterday. In December, Hobart is on daylight saving time and runs 19 hours ahead of Los Angeles. So at 11 am on a Tuesday in Hobart, it is still 4 pm on Monday in Los Angeles, and "yesterday" in your reports is the Los Angeles Sunday. In Hobart terms, that runs from 7 pm on Sunday to 7 pm on Monday. It is not the day you had in mind, and your Monday evening orders are not in it.3
This is not a flaw in any AI tool. It is how the report works. But when you ask in English, you picture your own calendar, and the report uses the property's calendar. The only way to know which one was used is to look.
Is this how the Advisor builds its requests? Again, Google has not said. But there is one published example of Google wiring a language model to GA4. In July 2025, the Google Analytics team released an experimental open-source MCP server, a small program that lets an AI model such as Gemini call GA4 tools. One of its tools is run_report, which "Runs a Google Analytics report using the Data API". So in Google's own published design, the model does not read your data directly. It writes a report request, gets the result, and then writes a sentence about it. The choices are in the request. The sentence is what you read.
The flags that travel with every report
Now, the useful part. When the Data API returns a report, the numbers come with a block of response metadata. Three fields in it are warning lights:
subjectToThresholding: if true, the report "only returns data that meets the minimum aggregation thresholds". Some rows may be missing, for privacy reasons.samplingMetadatas: present only if the result is sampled, and it describes "the percentage of events used in this report", one entry per date range.dataLossFromOtherRow: if true, some combinations of dimension values are rolled into the "(other)" row. The documentation adds a detail I love: the field is set even if a filter has hidden the (other) row from your results, because the loss happened in the table underneath.
In the GA4 interface, the same warnings show up as the data quality indicator, the small icon next to a report's title or in the corner of a card. Its states include "Unsampled report" ("based on 100% of available data"), "Thresholding applied", and "Heavily sampled exploration", with an example of a report "based on 8.88% of available data".
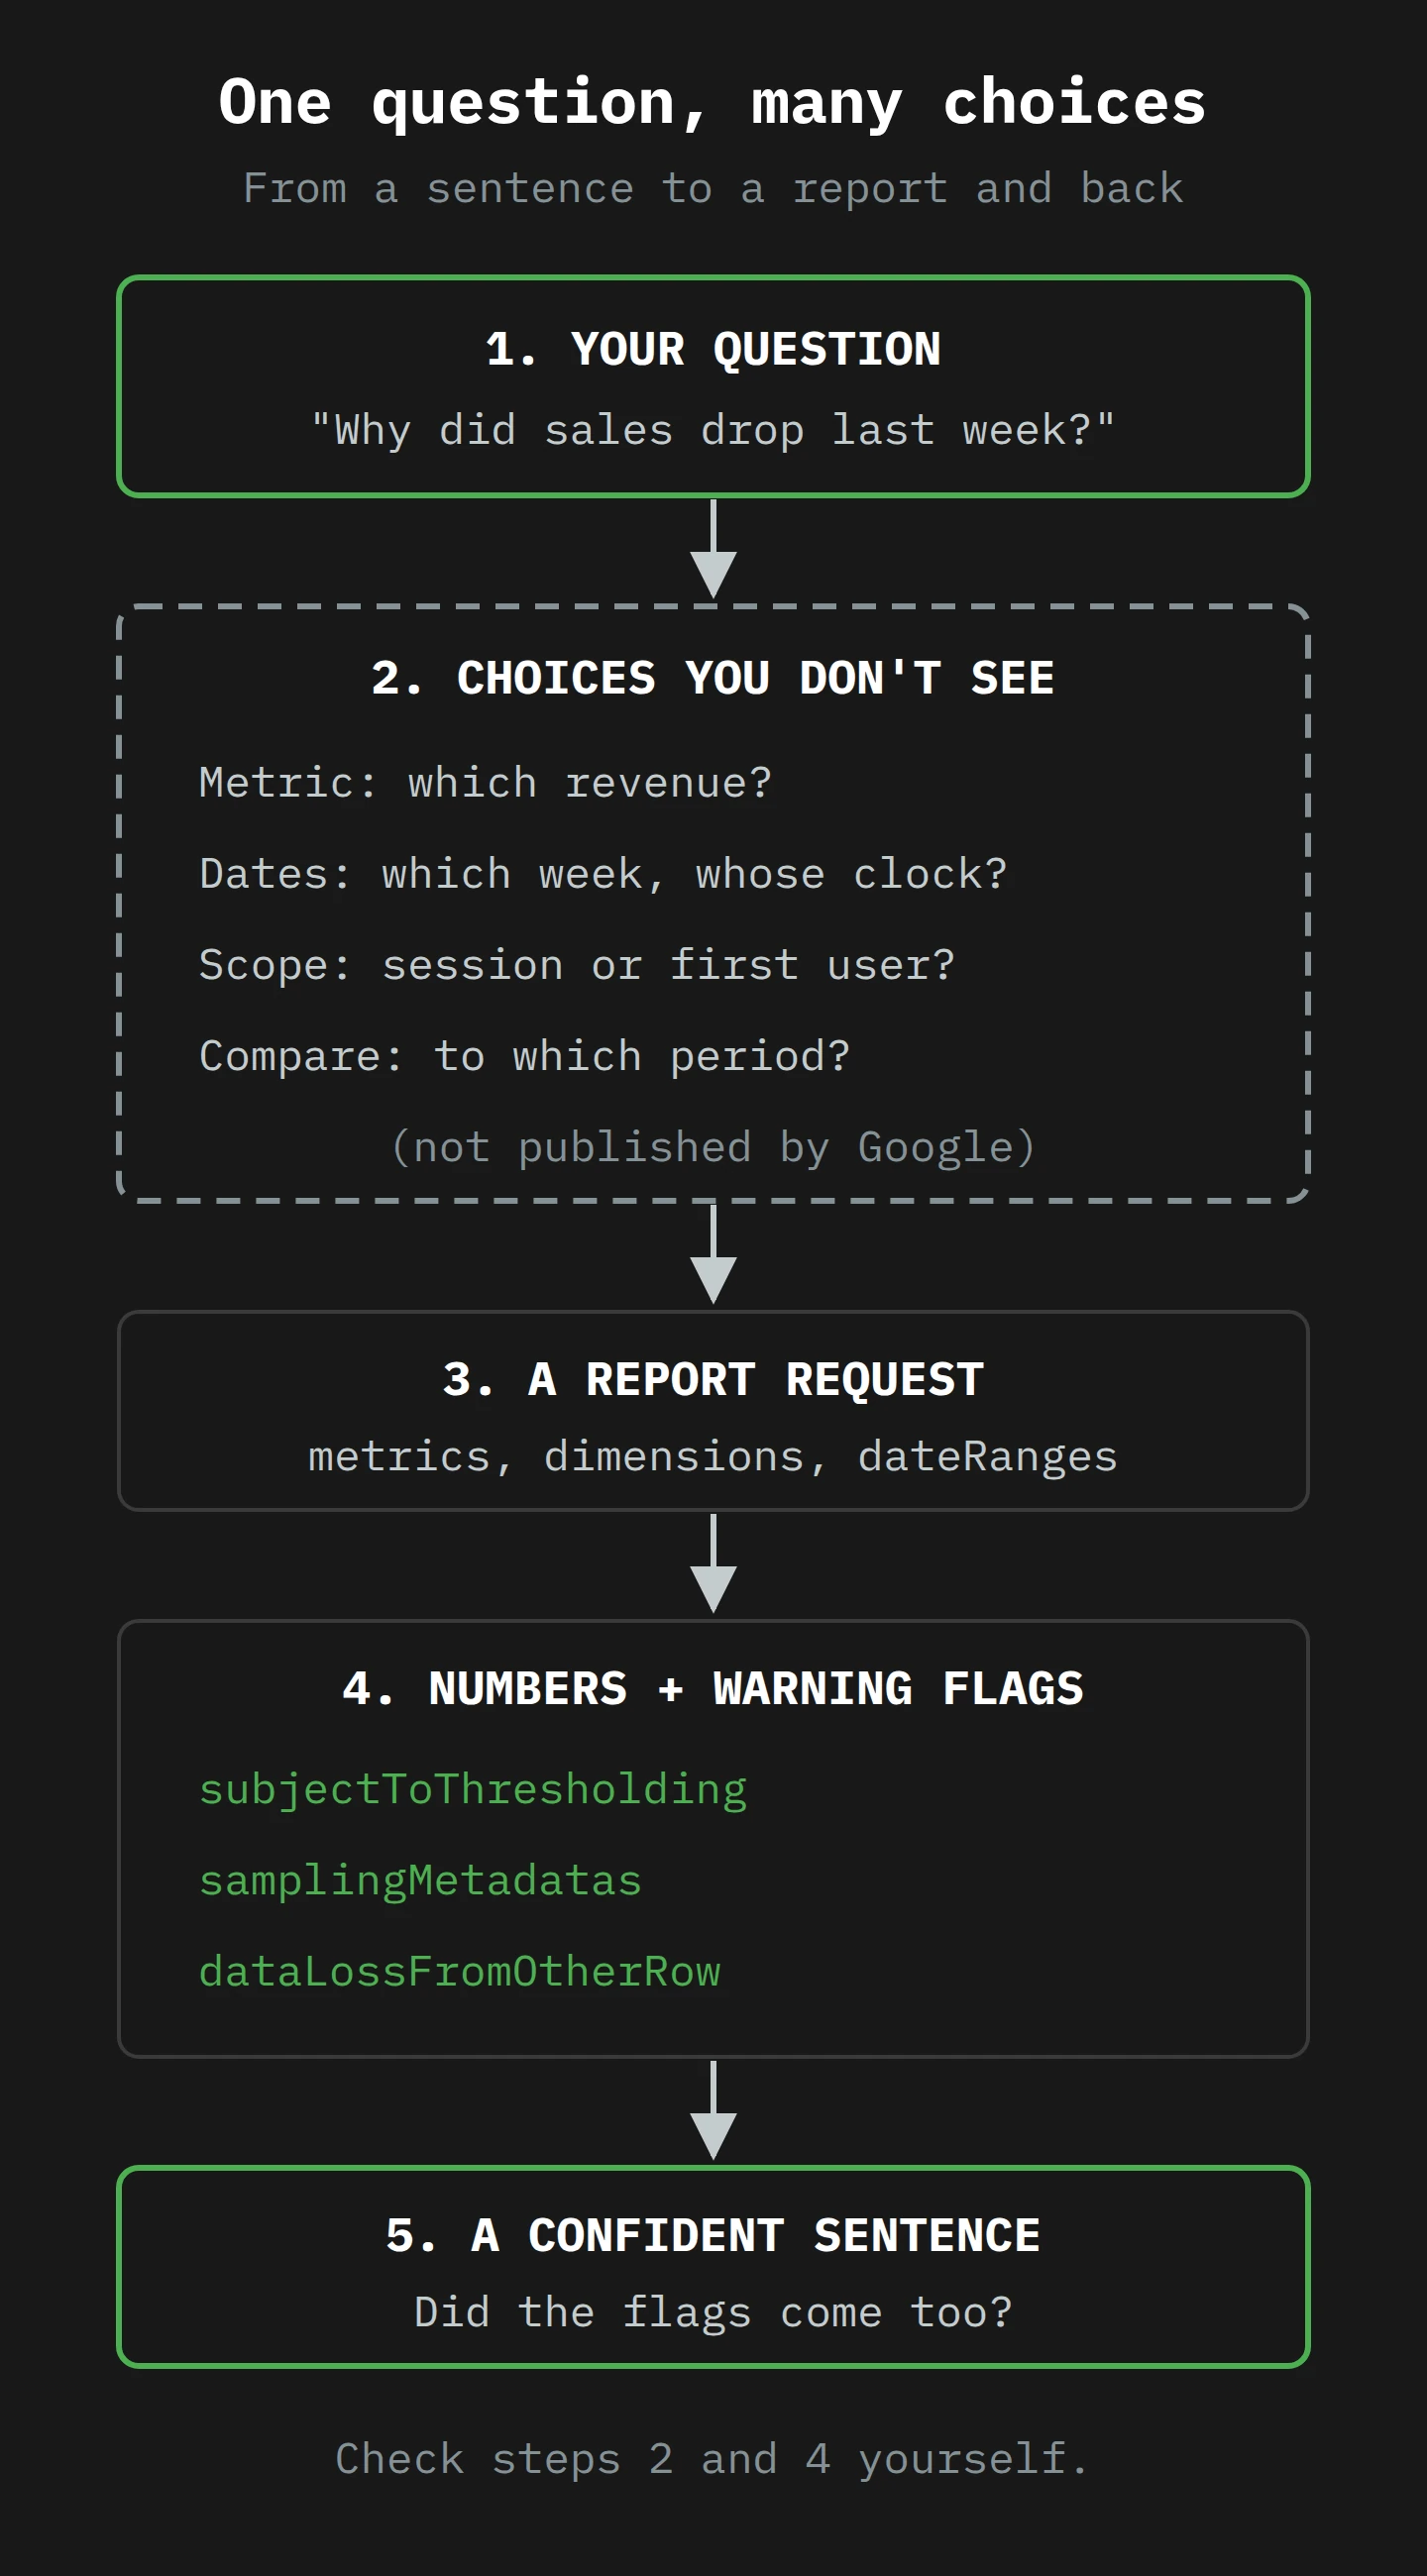
So every GA4 report carries its own fine print. A report request goes in, and the numbers come back with the fine print attached. Then a sentence is written. The question you must always ask about the sentence is simple: did the fine print survive the trip?
This is the same lesson I went through in AI Hallucinations 101, from a different direction. A language model writes fluent text. Fluency is not accuracy, and it is certainly not a footnote. A well-written sentence about a thresholded report reads exactly like a well-written sentence about a complete one.
Part 3: Five Checks Before You Forward It

Think of an AI-generated answer as a parcel arriving at a customs house. It looks fine from the outside. It is well wrapped. It has a confident label. Your job is to walk it past five inspectors, each of whom checks one thing, before it goes anywhere near the leadership channel.
But first, the doorman. His job comes before the inspectors, and it is simple: rebuild the report. Find the report or exploration the answer must have come from (the metric, the dimension, the date range), open it yourself, and make the numbers match. If you cannot make them match, stop there. Everything else depends on having the same report in front of you. Then the five checks.
Check 1: Thresholding, or the rows that were hidden for privacy
I wrote a whole post about thresholding in 2023, and the principle has not changed. Here is the short version, from the December 2025 help page.
GA4 withholds some data so that nobody can work out who an individual user is "based on demographics, interests, or other signals present in the data". The thresholds are "system defined. You can't adjust them." The help page gives no number. It tells you when they tend to apply: reports that include demographic data or audiences built from it, and reports with search query information, where a row "may be withheld if there aren't enough total users".
There is a second trigger, on the reporting identity page. If your property uses the Blended or Observed reporting identity, which draw on user IDs and signed-in activity, your property "must have enough activity from signed-in users to adequately obfuscate their identity. As a consequence your reports are subject to data thresholds." In October 2023, Google added an option to turn off Include Google Signals in Reporting Identity. Turning it off "can help reduce the likelihood of data thresholding" for exactly those properties.
The mechanism is easy to picture. Imagine a village with one left-handed cellist. A report that says "one left-handed cellist visited the pricing page on Tuesday" has told you who visited the pricing page on Tuesday. Thresholding removes that row. Across a whole report, it removes all the small rows, and small rows are often exactly the ones a "why did this change" question cares about: the new campaign, the small country, the one-day date range.
What this does to an answer: the total can look fine while the breakdown is missing pieces. An assistant that says "most of the drop came from channel X" may be working from a table where channels Y and Z are partly hidden.
The check: open the report and look at the data quality indicator. If it says "Thresholding applied", treat any breakdown in the answer as incomplete. Then try what Google suggests: widen the date range. The help page says that expanding the date range "may increase the number of users who triggered an event, enabling you to see the previously thresholded data". If the story changes when the rows come back, the original answer was built on a table with holes in it.

Check 2: Sampling and the (other) row, or the parts that were estimated or bundled
Two different mechanisms, one symptom: the report did not use every row of your data exactly.
Sampling is the older and better-known one, and I went through it at length in Just a Byte. Google's sampling help page explains it with trees: to estimate the trees in 100 acres of fairly even forest, count one acre and multiply by 100. In GA4, sampling may happen when the events needed for a report or exploration exceed the property's quota. As of December 2025, the quota for event-level queries is 10 million events for standard properties. For 360 properties it is up to 1 billion, with a default of 100 million per query. When sampling happens, the data quality icon shows the percentage of data used.
Standard reports are not always safe: Google notes that filtering large datasets by country "may result in data sampling in standard Google Analytics reports and Explore", mainly for datasets over 100 million events. And a "why" question is, by its nature, a request to slice the data many ways at once.4
The (other) row is quieter, and I think it is the one more people miss. Every dimension has a number of distinct values: its cardinality. Is key event has two. Page path might have one for every URL on your site. GA4 stores reports in tables with row limits, and when a table has more rows than the limit, "Analytics surfaces only the most common dimension values and condenses less common values under the (other) row". The (other) row help page gives an example: a table with a 100k row limit and 150k unique pages sorts the pages by frequency and bundles the last 50k into (other).
Google treats any dimension with more than 500 values as high cardinality. And it warns that reports with secondary dimensions, filters or comparisons are more likely to hit the limit, because they need tables with many dimensions at once. That is exactly what a "which pages, from which channels, on which devices" question asks for.
Picture a village census where the clerk writes down every family that has more than ten members, and puts everyone else on one line called "assorted smaller families". The big families are counted exactly. The long tail is one lump. If your question is about the long tail, the census cannot answer it.
The check: look at the data quality icon for a sampling percentage or an (other) row warning. Look for an "(other)" value in the table. Google notes that the warning can appear even when no (other) row is visible, because a filter has hidden it, which matches the dataLossFromOtherRow flag in the API. If the answer names a specific page, product or campaign as a cause, check that it is not a value that sits next to a large (other) row.
Check 3: Unassigned traffic and scope, or the rules that sorted the visits
This one is about the dimension, not the numbers. GA4 does not know where a visitor came from. It infers it, using rules.
The default channel group help page sets them out. "Channels are rule-based definitions" of your traffic sources, and the default ones can't be edited. Direct, for example, is when the source is exactly "(direct)" and the medium is "(not set)" or "(none)". Email is when the source or medium is email, e-mail, e_mail or e mail. And then there is the last line of the table: "Unassigned is the value Analytics uses when there are no other channel rules that match the event data."
So Unassigned is not a place. It is a leftover bin for traffic that fell through the rules. My Unassigned traffic post goes through the usual causes, and campaign tags that do not match Google's rules are one of them. A newsletter tagged utm_source=mailout and utm_medium=newsletter matches no rule at all, so it does not land in Email. It lands in Unassigned.
What this does to an answer: if a newsletter goes out with a new tag, Email goes down and Unassigned goes up, and nothing about your email performance has changed. An assistant asked "why did email drop?" may give you a thoughtful analysis of subject lines. The real answer is a spelling.
There is a second trap in the same dimension: scope. GA4 has three default channel-group dimensions, and they answer three different questions. The scopes help page explains it. First user default channel group credits the channel that first brought each user to your site. Session default channel group credits the channel that started each session. Default channel group, with no prefix, is event-scoped: it credits the channel behind a key event, using your property's attribution model, which is data-driven by default.
Google's own example makes the gap visible. The same property, the same events, broken down by first-user medium and by session medium:
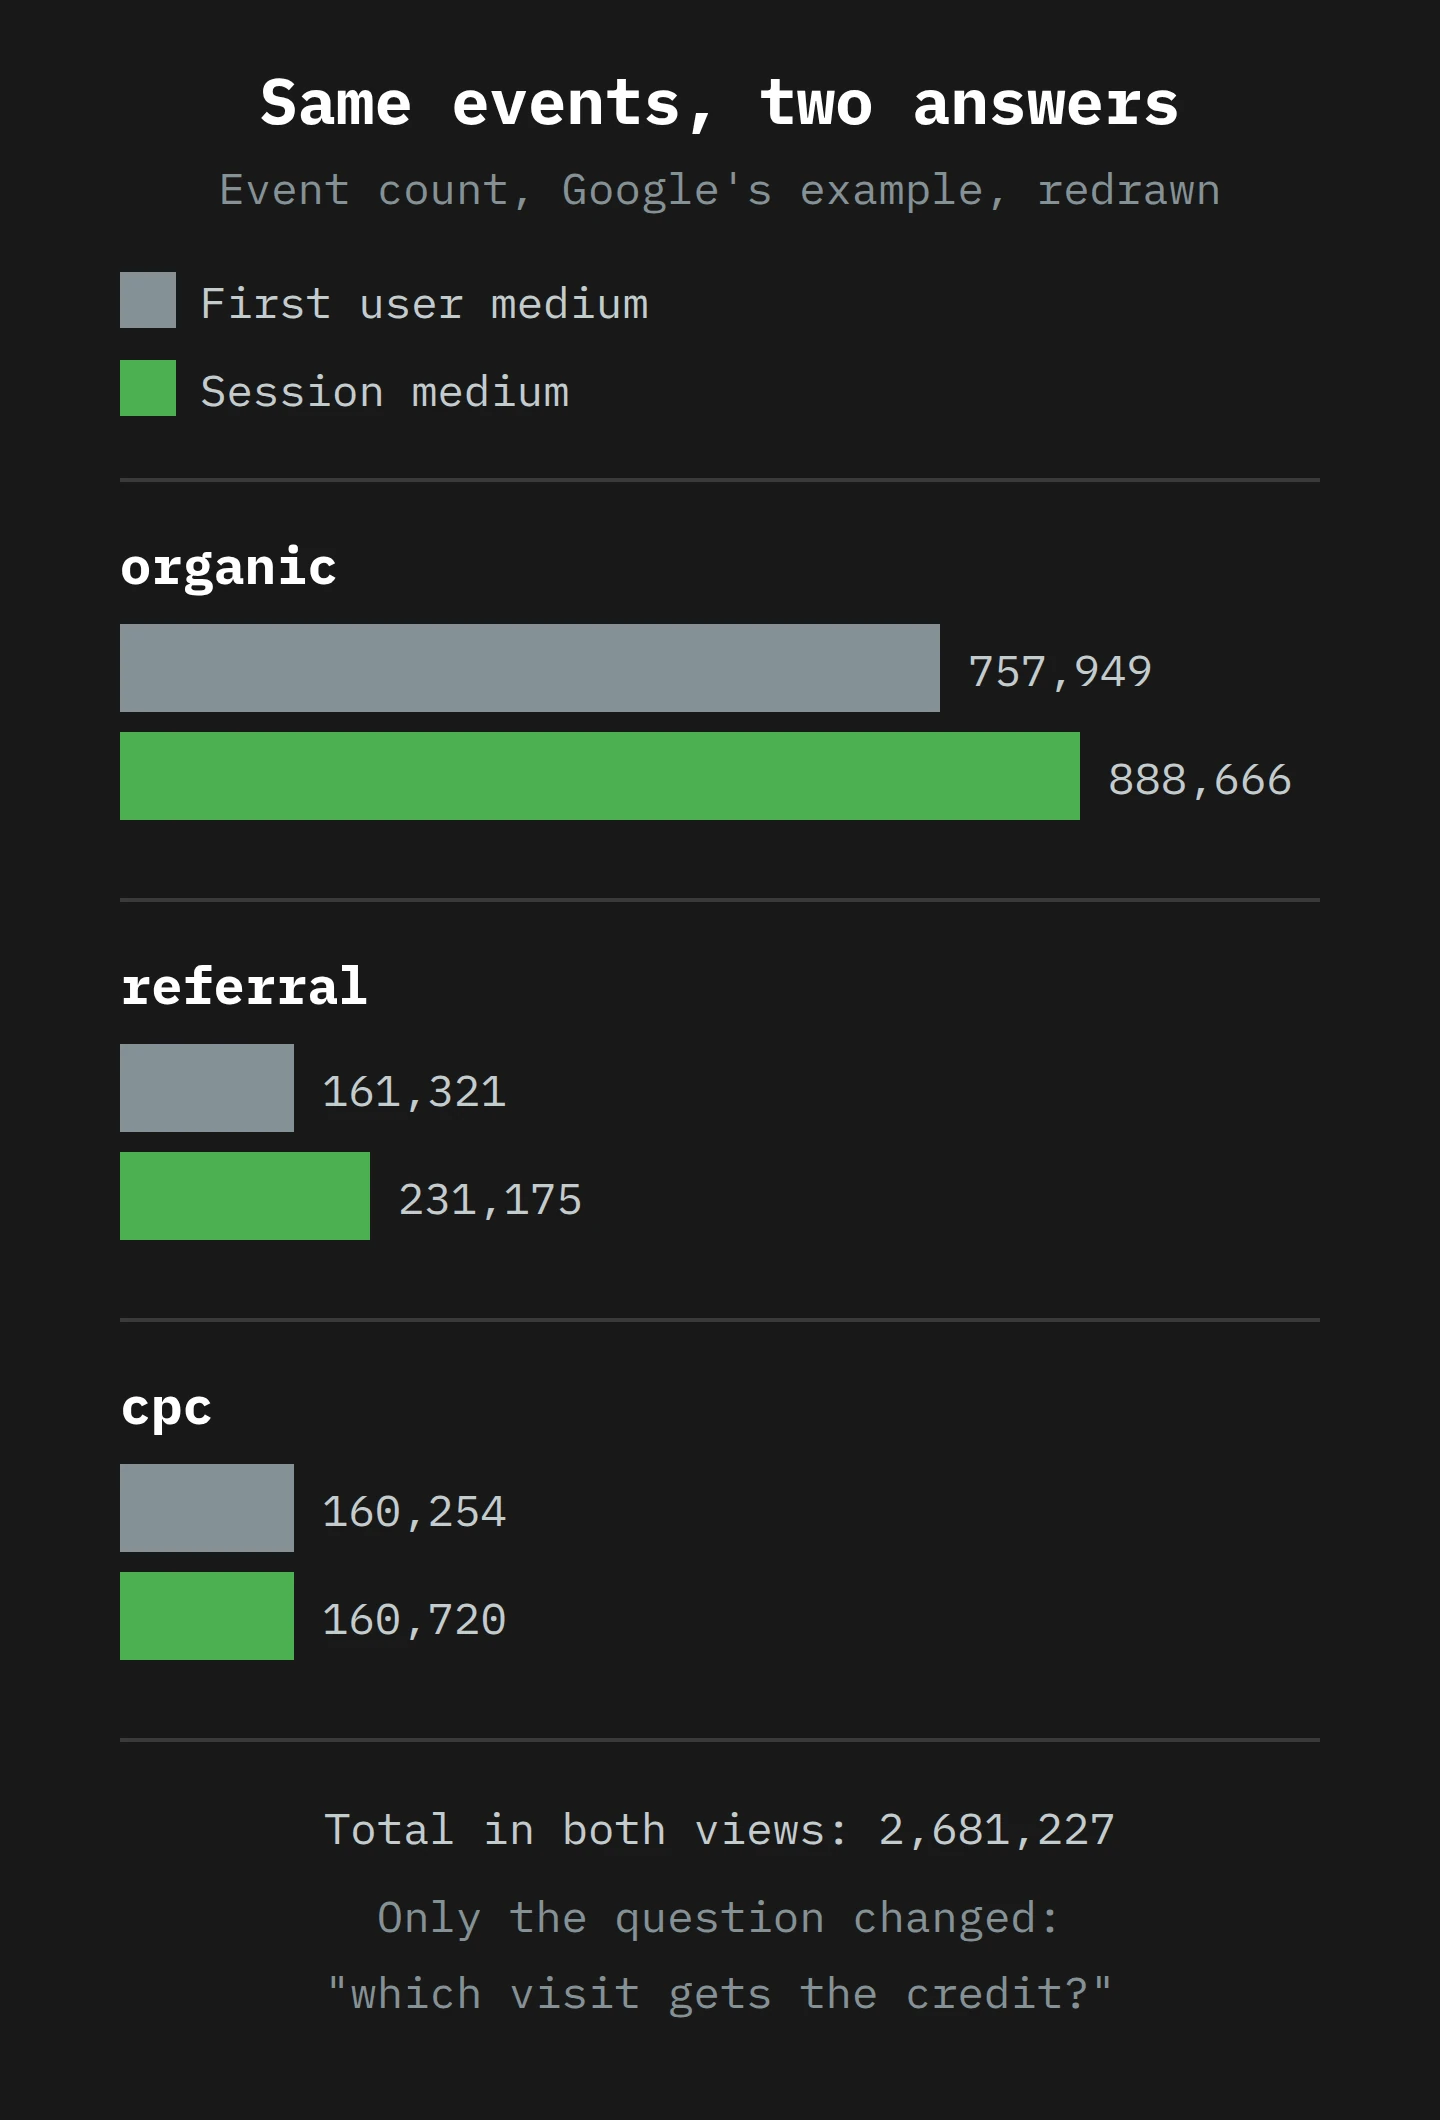
Both views add up to 2,681,227 events. Organic gets 757,949 of them by first user and 888,666 by session. Neither number is wrong. They answer different questions: "which channel found these people?" and "which channel brought them back this time?" A plain-English question like "how is organic doing?" does not say which one you meant.
The check: when an answer names a channel, find out which channel dimension it used, and look at the Unassigned row in the same report. If Unassigned moved in the opposite direction to the channel the answer blames, check your campaign tags before you check anything else.
Check 4: Date ranges and freshness, or the numbers that were not finished yet
We met the time zone trap in Part 2. There is a second trap in the date range, and it is about time itself: recent data is not final.
The data freshness help page says it directly: "Data processing can take 24-48 hours. During that time, data in your reports may change." Before the daily data is ready, GA4 serves intraday data, which comes with conditions. There can be "temporary gaps" in event-scoped traffic source dimensions such as source, medium, campaign and default channel group. Stricter cardinality limits may apply, so you are "more likely to experience the '(other)' row". Some data "can arrive late, potentially up to 7 days delayed". And after the daily data lands, "attribution credit for key events can change for up to 12 days after the key event is recorded".
Picture the village baker's weekly tally, written up on Sunday night with Saturday's takings still in the till and a few of Friday's orders still on the cart somewhere between here and the next village. The tally is not wrong. It is early.
What this does to an answer: any question that includes the last two days is a question about numbers that may still move. A "why did X drop yesterday?" question is the most likely of all to be answered with unfinished data. Yesterday often looks like a drop simply because yesterday is not finished.
The check: write down the exact start and end dates the answer used, and the property's reporting time zone (in Admin, in the property settings). If the range includes the last 48 hours, run the same comparison again in two or three days. If the answer is about attribution, give it longer still. When you compare periods, compare complete ones.
Check 5: Definitions, or the metric that had the same name as the one you meant
The last inspector reads the label on the parcel very carefully.
GA4 has several metrics that sound alike. The Data API's list of metrics makes the differences precise. Total revenue is "the sum of revenue from purchases, subscriptions, and advertising", minus refunds. Purchase revenue is revenue from purchase, in-app purchase and app store subscription events, minus refunds. Ecommerce purchases counts purchase events. Transactions counts a wider set of events with purchase revenue, including refunds. If your site shows ads, or sells subscriptions through an app, "revenue" can mean noticeably different things.
Users are the same. The user metrics help page defines Total users as unique users who triggered any event, and Active users as users who engaged: an engaged session (10 seconds or more, a key event, or two or more page views), a first visit, or engagement time. New users may exceed active users, because not all new users are active. And the page adds that "factors such as thresholding may contribute to discrepancies in these numbers". Checks 1 and 5 meet here.
Google's own example question for the Advisor is "Trend of active users over the last 30 days". That is a precise question. "How many people visited?" is not. It could be total users or active users, and they are counted differently: any user who triggered an event, or only a user who engaged.
The check: find the exact metric name the answer used. If it only says "users", "revenue" or "conversions", ask for the metric by name, or rebuild the report with each candidate and see whether the story holds for all of them. If it holds for all of them, good. If it holds for only one, you now know which question the answer was really about.
Part 4: Odette Checks the Advisor's Homework

Meet Odette. Odette makes apple cider vinegar in Cygnet, in the Huon Valley, and sells it online in stoneware bottles to people who have strong opinions about stoneware. (She is made up. The apples of the Huon Valley are not, and they would like that noted.) Her GA4 property was set up in 2021 by a web developer who has since moved to Queensland. She runs a newsletter, some Google Ads, and a small amount of Instagram, mostly photos of the orchard dog.
In mid-December, Odette gets the Advisor icon in her property. The figures and replies below are invented for Odette, to show the method. I cannot show you what the Advisor would say to your property, and it may not say the same thing twice anyway.
Monday: ask, and write the question down
Odette types: "Why did sales drop last week compared to the week before?"
Suppose the Advisor answers that revenue fell 22%, mostly from a drop in Email, and suggests she look at her newsletter content. It shows a neat bar chart.
Odette does not forward it. She copies the question and the answer into a note, word for word, with the time she asked (Monday, 10:40 am, Hobart time). Then she writes down every choice the question left open: which revenue metric, which "week", in which time zone, which channel dimension, and whether "sales" meant revenue or orders. That note takes three minutes, and it is the most important thing she does all week.
Tuesday: rebuild the report
Odette opens Reports, then Acquisition, then Traffic acquisition. She sets two complete weeks, Monday to Sunday, and compares them. She picks Total revenue, because that is the metric the chart label shows, and the dimension Session default channel group.
Her total matches the Advisor's within a few dollars. Good. The doorman lets it in. She checks the data quality icon: "Unsampled report". No thresholding flag. Checks 1 and 2, done in under a minute, because a small shop with a standard report rarely hits either one.
Wednesday: check the dates and the time zone
In Admin, in her property settings, the reporting time zone is "(GMT-08:00) Los Angeles". The developer set it that way, and nobody has touched it since.
That means her "week" starts at 7 pm on Monday, Hobart time, in December. Her Monday morning orders, when her regulars buy after the newsletter lands, fall in the previous week. And she asked at 10:40 am on Monday in Hobart, which was 3:40 pm on Sunday in Los Angeles. She cannot see which dates the Advisor chose, which is the point. But if it read "last week" as Monday to Sunday in the property's time zone, the last day had not finished yet, and the freshness page told her that the last two days could still move.
She could change the time zone, but Google's setup page says a change "only affects data going forward".5 But she can compare complete weeks, and she waits until Thursday to do it.
Thursday: check the channel rules
On Thursday she re-runs the comparison with complete data. The total drop is now 9%, not 22%. And the channel breakdown tells a different story. Email is down sharply. Unassigned is up by almost exactly the same amount.
She opens the last newsletter in her email tool. The developer's old template used utm_medium=email. Her new template, which she built herself in November, uses utm_source=mailout and utm_medium=newsletter. Neither value matches a rule in the default channel group. So the newsletter traffic fell through to Unassigned. Her email performance did not drop. Her email's label did.
She switches the dimension to First user default channel group, out of curiosity. The Email line looks much more stable there, because most of her newsletter readers first found her in other ways years ago. That is a different question, and she notes it for later.
Friday: check the definition, then write the real answer
Last, the metric. Odette sells only through her own shop and shows no ads, so Total revenue and Purchase revenue should be close. She checks both. They match, because both subtract the same refunds. Check 5 passes.
So her real answer, which she writes into the same note, is: "Revenue for the week of 8 December was down 9% on the week before, comparing complete weeks. Most of the apparent Email drop is newsletter traffic in Unassigned, caused by a new utm_medium value. The remaining drop is within normal week-to-week variation for December." Then she fixes the newsletter template and makes a note to switch future reporting to a custom channel group.
Then she goes back to the Advisor, because it is useful, and asks a better question: "Compare total revenue by session default channel group for the complete weeks of 1 December and 8 December, including Unassigned." A precise question leaves the assistant fewer choices to make on its own. The answer comes back in seconds, and this time she can check it in two minutes, because she knows what to check.
The Routine, Step by Step
You can do this with the Advisor, with an MCP-connected model, or with a chatbot someone pasted a CSV into. The routine is the same.
- Save the exact question and answer, with the time you asked. You cannot check an answer you have paraphrased.
- List the choices the question left open: metric, dimension, date range, time zone, comparison, filters. If there are more than two, ask the question again more precisely before you check anything.
- Rebuild the report yourself in Reports or Explore, and make the headline number match. If it does not match, stop and find out why.
- Read the data quality indicator. "Thresholding applied" means breakdowns are incomplete. A sampling percentage means the numbers are estimates. An (other) warning means the long tail is bundled.
- If thresholding is on, widen the date range and see whether the story changes. If your property uses Blended or Observed reporting identity, try the same report with Device-based identity, which you can switch back at any time.
- Look at the Unassigned row whenever an answer blames or credits a channel. Then check the campaign tags on anything you sent in that period.
- Name the channel scope: first user, session, or event-scoped. Ask the question again in the other scopes if the decision depends on it.
- Check the reporting time zone in Admin, in the property settings, and write the actual start and end dates next to the answer.
- Leave out the last 48 hours, or re-run the check a few days later. For attribution questions, allow up to 12 days.
- Confirm the metric by its exact name. "Revenue", "users" and "conversions" are each more than one metric in GA4.
- Write the verified answer in your own words, with the dates, the metric and any warnings, before it goes to anyone else. The screenshot of the chatbot is not the answer. Your note is.
- Use the thumbs down when an answer fails a check. The help page says the thumbs buttons send feedback to the product team, so a failed check is useful to someone.
Final Thoughts
Think back to that Monday night: the question in the little box, the seven-second answer, the taskforce with the good biscuits. The assistant did what it said on the tin. It read a report and wrote a sentence. The report had its warning lights on, and the sentence did not mention them.
That is the one thing to take away. An AI answer about GA4 is a summary of a GA4 report, and as Google's own help page puts it, it "reflects information that is available in Google Analytics". Every limit of the report is a limit of the answer. So you check the answer by rebuilding the report and reading its fine print: thresholding, sampling and the (other) row, the channel rules and their scope, the dates and their time zone, and the exact metric.
The Advisor is new, and as of December 2025 it is English-only and still labelled Beta in parts of Google's own help. It will probably get better at showing its working. Until it does, the working is yours to show. This week, pick one real question you would normally ask the analyst, ask the Advisor instead, and then run the five checks against its answer. Keep the note. It will tell you more about how far to trust the tool than any launch post.
Now, if you'll excuse me, my tea has been brewing for exactly as long as I said it would. I checked the time zone.
Notes
-
The release note of 12 December calls it a launch. The help page, captured the day before, still listed it as "Analytics Advisor (Beta)" and said the icon appears "if your account is eligible". Rollouts at Google take a while, so seeing it in one property and not another in December 2025 is not surprising. ↩
-
Google's Analytics Advisor help page says your chat activity "may be used to improve the product", under Google's terms and AI use policy. So keep customer names, email addresses and anything else sensitive out of the chat box, the same as you would with any other AI tool. ↩
-
In December, Hobart is on daylight saving time at UTC+11 and Los Angeles is on standard time at UTC−8. Nineteen hours is most of a day, which is roughly how far ahead of the rest of the world Tasmanians already feel on a good morning. ↩
-
Even an "unsampled" GA4 report estimates some counts. Google uses an algorithm called HyperLogLog++ to count distinct things like active users and sessions, and its sampling page says the difference from an exact count is "less than 1%" in most cases. It is a sensible trade, and it is one more reason that two tools can disagree by a few users. ↩
-
Google warns that after a time zone change you may see "a flat spot or a spike" in your data where the clock shifted, and it recommends changing the time zone no more than once a day. Pick a quiet day to do it, and write the date down. ↩