Mix and Match: Marketing Mix Models vs Attribution
Odette runs a small cidery in the Derwent Valley. It has a cellar door, a farm-gate stall and an online shop, and it has a question at the till. Every customer who buys a bottle gets asked, pleasantly, "What brought you in today?"
After a year, she adds up the answers. Sixty-one per cent of customers said "the sign on the highway". The sign is a plain board with an apple painted on it, 400 metres before the turn-off. It cost $300 and a Saturday.
The radio ad on the local station got 4%. The review in the weekend paper got 2%. The stall at the Salamanca market, which takes up every Saturday morning and most of Odette's patience, got a single mention, from a man who was mostly there for the scones.
So Odette does the rational thing. She cancels the radio ad. She drafts a polite letter to the council about a second sign. Then, over a cup of tea, she begins to cost out a third sign, and a fourth, and a small lit-up one, and she sketches, on the back of an invoice, a future in which the entire Lyell Highway is lined with painted apples, and every customer arrives having read eleven of them.
Put the invoice down. Nobody lied to Odette. The sign really was the last thing most customers saw before the turn-off, and the question at the till is a good question. It answers "who got them to the door?" It does not answer "who made them want to come?", and it definitely does not answer "what would happen if I spent my money differently?" Those are three different questions. Most marketing reports answer the first one, and most budget meetings ask the third.
That gap is about to get a lot more visible. On 20 May, at Google Marketing Live, Google said it is bringing Meridian, its open-source marketing mix model, into Google Analytics 360. A marketing mix model, or MMM, is the other way to measure advertising. It asks no customer anything. It puts weeks of total sales next to weeks of total spend and works out what each channel adds. So many Analytics 360 teams will soon have an attribution report and an MMM in the same product, and the two will disagree. If you do not know why they disagree, you will pick the number you like best, which is how highway signs get built.
So we will take both methods apart, down to what Google's data-driven model computes and the curves inside an MMM. Then we will see why both need an experiment as referee, check what Google did and did not announce, and give Odette a real budget.
Let's get into it.
Part 1: Two Questions That Sound the Same
Here are two sentences you might hear in the same meeting.
- "Paid search drove 40% of our online sales last quarter."
- "If we move $20,000 from paid search to YouTube next quarter, we will sell more."
They sound like the same topic. They are not. The first one is about credit: of the sales that happened, which channels do we give the credit to? The second one is about cause: if we change what we spend, what changes in the world?
Credit is an accounting question. You have a fixed pile of sales and you divide it up, like a restaurant bill. Nobody asks whether the bill would be smaller if Gerald had not ordered the lobster. They only argue about who pays for it.
Cause is a "what if" question. It needs you to imagine a world that did not happen, the one where you spent the money differently, and to estimate what would have happened there. Statisticians call that imagined world the counterfactual. You never see it. You can only estimate it, and every method in this article is a different way to estimate it.
An attribution report answers the credit question. An MMM answers the cause question. Use an attribution report for a cause question (most of us do, because it is the report we have) and you get an answer that sounds right and can be badly wrong. Odette's sign is the gentle version. The expensive version is a company that pays for ads shown to people who were going to buy anyway, with a report that says those ads are its best performers.
Part 2: How Attribution Shares Out the Credit
You already do attribution
You tell the story of how you met your partner, and it starts with whoever introduced you, not with the third cousin whose wedding it was. That is attribution: a rule for handing credit to one or more of the things that happened before an outcome.
Google Analytics puts it formally: attribution is "the act of assigning credit for important user actions to different ads, clicks, and factors along the user's path". The rule that decides the split is the attribution model.
The rules-based models
In 2021 I wrote a long piece on the classic attribution models, with a cup of tea, a guinea pig and a Tasmanian apple pie standing in for the customer journey. Last click gave everything to the final touch. First click gave everything to the first. Linear split it evenly. Time decay gave more to the most recent touches, and U-shaped gave more to the first and the last.
Here is the update. Google Analytics 4 now has only three models. According to Google's help page, first click, linear, time decay and position-based (the U-shaped one) "are no longer available as of November 2023". What remains is:
- Paid and organic last click: 100% of the credit to the last channel the person clicked (or, for YouTube, an "engaged view") before converting, ignoring direct visits.
- Google paid channels last click: 100% to the last Google Ads click. If there was none, it falls back to the model above.
- Data-driven attribution (DDA): credit shared across the path by a model trained on your own data. This is the interesting one.
One detail from that page matters later. All the models exclude direct visits from credit "unless the path to key event consists entirely of direct visits". Hold that thought.
How data-driven attribution works
Google explains more of DDA than people expect. The model looks at paths from people who converted and people who did not. It learns how the presence and timing of each kind of touchpoint changes the chance of a key event (the action you care about, such as a purchase). Then it gives each touchpoint credit according to how much it changes that chance.1
Google gives a worked example. A path with four ad interactions (paid search, social, affiliate, search) has a 3% chance of converting. Take away the fourth interaction and the chance drops to 2%. So that interaction "drives +50% key event probability", and the model repeats the test for each interaction and uses the results as weights. The help page calls this "a counterfactual approach", and it says the models compare exposed users with "similar users in a holdback group", trained on data from randomised controlled trials for Google ad exposures.
That is a real counterfactual, and much better than a fixed rule. So why is DDA still an answer to the credit question? Three reasons, all in the plumbing.
Limit 1: The credit always adds up to the whole sale
The settings page is plain about it: for a path with two keywords, each gets fractional credit, which "sums to 1.0". Every conversion is shared out in full among the touchpoints on its path. There is no box on the form for "this person would have bought anyway".
Remember the direct-visit rule. If a path has even one click from another channel, direct visits get nothing, and the other touchpoints take the whole sale between them. So if a loyal customer types your address into the browser every month but clicks a brand search ad once on the way, that ad click gets 100% of that month's sale. The counterfactual inside DDA can move credit between touchpoints. It cannot give credit back to the customer's own habit.
This is Odette's sign. Her regulars drive past it too, and it gets the credit for them.
Limit 2: It sees only what it can see
Attribution works on clicks and engaged views that it can tie to a conversion in the same property, within the lookback window, which by default is 90 days for most key events. A person who saw your billboard, heard your podcast ad and watched half your YouTube video without clicking leaves no footprint in the path. Neither does a person who declined analytics cookies, or who researched on their work laptop and bought on their phone. I wrote about the consent side in No Consent, No Conversions, and the device side in Why Facebook & Google Ads Over-report.
The effect is not random. Channels that live close to the purchase and produce clicks (search, remarketing, email) are easy to see. Channels that build demand weeks earlier and rarely produce a click (radio, TV, video, podcasts, a stall at the Saturday market) are hard to see. So attribution does not only miss some credit. It moves credit towards the bottom of the funnel, every time, in the same direction.
Limit 3: Targeting makes the ads look better than they are
This is the big one. Ads are not shown at random. Search ads go to people already searching for you, and remarketing ads to people who already visited your site. They were more likely to buy before they saw anything.
Two Google researchers, David Chan and Michael Perry, name exactly this in a 2017 paper. They call it selection bias, and they give paid search and remarketing as the two examples that "can have severe selection bias", because both are aimed at people who have already shown interest.
The most famous demonstration is eBay's. In March 2012, eBay switched off its brand-keyword ads (searches that included "ebay") on Yahoo! and Microsoft's search engines. Economists Tom Blake, Chris Nosko and Steven Tadelis studied the result: 99.5% of the click traffic that the ads used to bring in arrived anyway, through the free (natural) search results. The paid link had mostly been catching people on their way to eBay. The authors concluded that brand-keyword ads had "no measurable short-term benefits", and that returns from paid search were "a fraction of conventional non-experimental estimates".2
Any attribution model would have given those brand ads a large share of the credit, because every one of those people clicked the ad and then bought something.
What attribution is good for
None of this makes attribution useless. It is fast (daily) and detailed (keyword, ad, landing page), and it is right for comparing things that face the same bias, such as two ads in one campaign. The selection bias is roughly equal on both sides and mostly cancels out. When the question is "how much should this channel get next year?", it does not cancel out. For that, you need a method that puts a number on the sales that would have happened anyway.
Part 3: How a Marketing Mix Model Gets Its Numbers

Marketing mix models are not new. Chan and Perry trace them "since the 1960s". What is new is that the click trail is getting harder to follow. A 2024 paper that introduces Robyn, the open-source MMM that Meta's marketing data scientists built, says the same: privacy changes are limiting deterministic attribution, and so media and marketing mix modelling is making a comeback.
Google's Meridian documentation gives the short version. An MMM "uses aggregated data to measure impact across marketing channels and account for non-marketing factors", and it "is privacy-safe and does not use any cookie or user-level information". No customer journeys and no cookies. Just totals, by week.
We will build one from the ground up, in four steps.
Step one: you already do this in your head
Odette knows the cellar door is busier in the two weeks after the radio ad runs. She also knows it is busier in December whatever she does, and quieter when it rains. She is already comparing weeks, allowing for season and weather, and asking whether the weeks with more advertising sold more than they should have. That is the whole idea of an MMM. The rest is doing it carefully, with many channels at once.
Step two: draw a line through the weeks
Put Odette's weeks on a chart: radio spend along the bottom, sales up the side, one dot per week. Draw the straight line that fits the dots best, and its slope is a first guess at "extra sales per extra dollar of radio". That is regression: fitting a line so that one number is explained by others.
Now add the other channels, the season, the weather, a growth trend, and a baseline: the sales Odette would make with no advertising at all. Each week's sales become baseline, plus season, plus the effect of each channel. Look at what we just gained: a box for "would have bought anyway". Attribution does not have one.
A straight line has two problems, though. Advertising does not stop working the week you stop paying for it, and doubling the spend rarely doubles the result. Google's own researchers put it plainly in 2017: these effects are "hard to capture using linear regression". So a modern MMM bends the line in two places.
Step three: carryover and diminishing returns
Carryover (adstock). Someone hears the radio ad on Tuesday and visits two Saturdays later. The effect spreads over the following weeks and fades. Meridian models this with an adstock function. In the documentation's words, the cumulative media effect in a week is "a weighted average of media execution" in that week and the previous weeks, up to a maximum lag, with the weights set by a decay parameter called α (alpha). With the geometric version, each week further back counts for less by the same proportion. A high α means a long memory, a low α means the effect is gone almost at once. The model learns α for each channel from the data.
Diminishing returns (saturation). The first $1,000 on radio reaches people who have never heard of the cidery. The tenth $1,000 reaches the same people for the ninth time. Meridian models this with a Hill function:
Hill(x) = 1 / (1 + (x / ec)^(−slope))
That looks worse than it is. The docs say ec is "the half saturation point": the level of media where the channel delivers half of the most it can ever deliver. The slope sets the shape. At 1 or less the curve bends over from the start. Above 1 it is an S, slow at first, then steep, then flat.
Some made-up numbers make it concrete. Say Odette's radio has ec at $10,000 a month and a slope of 1.
- At $10,000, Hill = 1 / (1 + 1) = 0.5. Half the maximum effect.
- At $20,000, Hill = 1 / (1 + 0.5) ≈ 0.67.
- At $40,000, Hill = 1 / (1 + 0.25) = 0.8.
Doubling the spend from $10,000 to $20,000 buys a third more effect, not twice as much. Doubling again buys a fifth more. This is the curve that makes an MMM useful for budgets. Where a channel sits on its curve tells you whether the next dollar is worth more there or somewhere else.
Step four: put it together
Now we can write the real thing. By default, Meridian runs each channel's weekly media through adstock first, then through the Hill curve, and multiplies the result by a coefficient, β (beta), that sets how big the channel's effect is. The docs give the effect of channel m in region g and week t as β × Hill(Adstock(media)). Add up those effects for every channel, add the baseline, the trend, the season and any control variables, and you have the model's estimate of that week's sales.
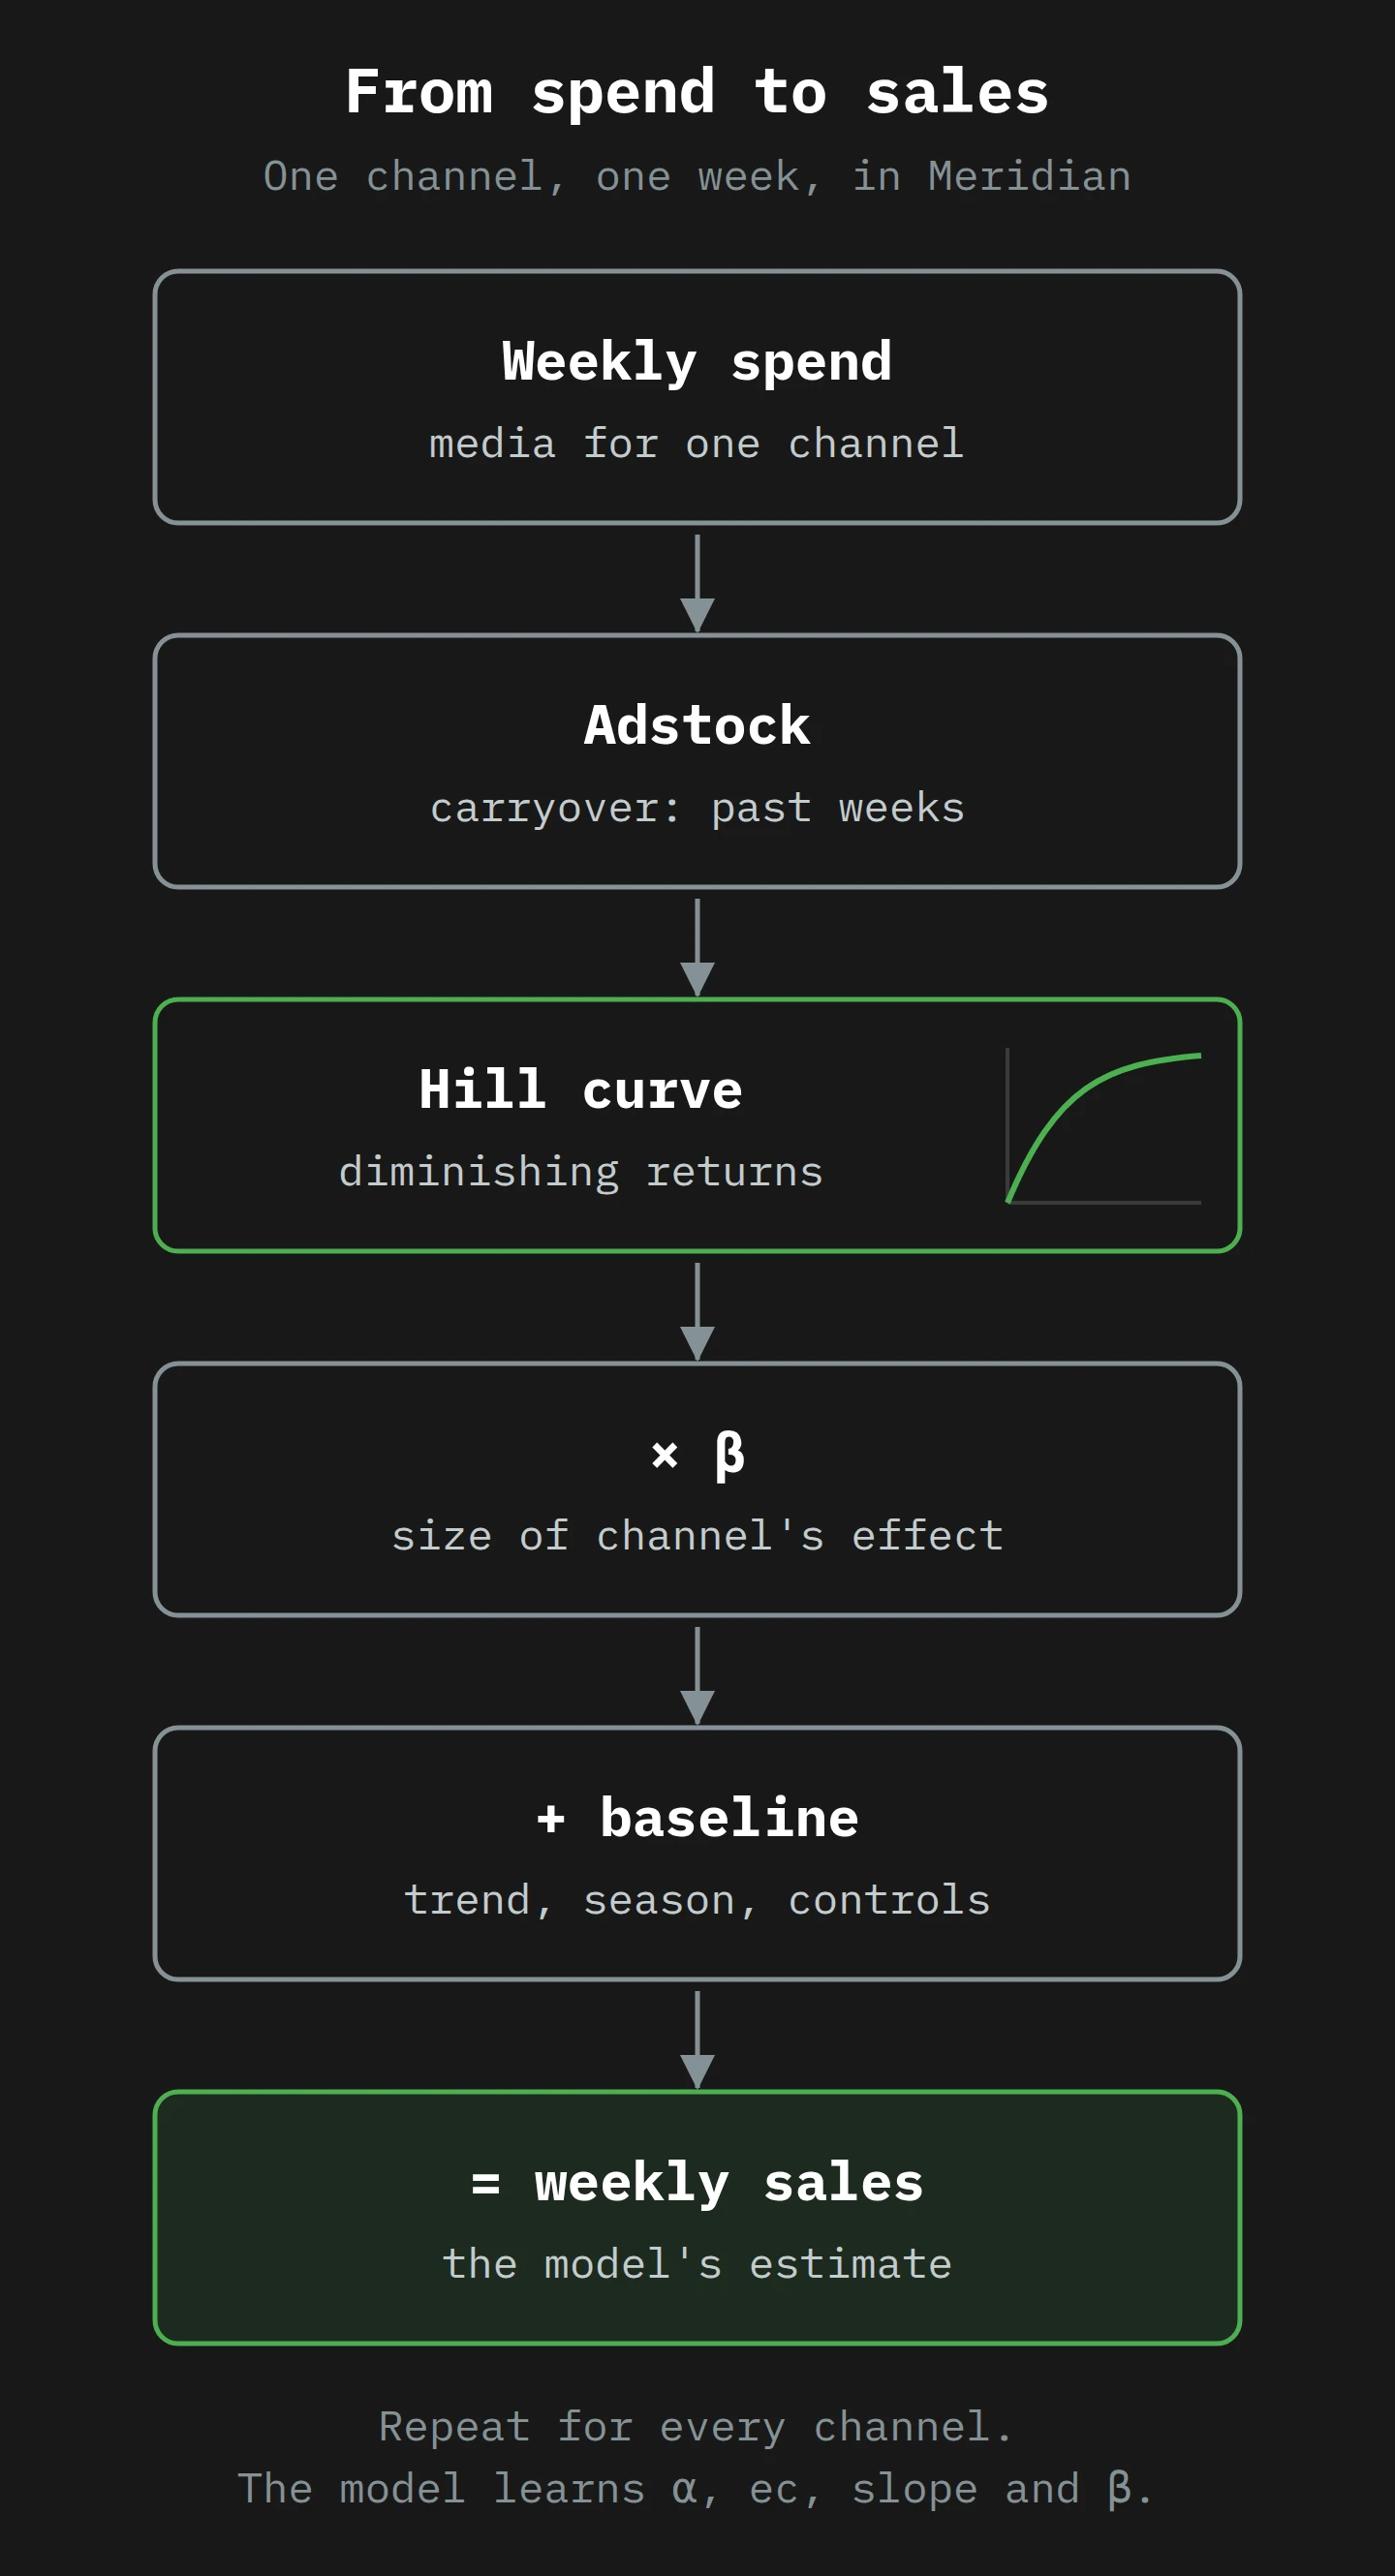
The model's job is to find the α, ec, slope and β for every channel, plus the baseline, that best match the real weekly sales. Then it can answer Meridian's three core questions: what was the historical return and contribution of each channel, what does each channel's response curve look like, and how should the next budget be allocated.
The problem with step four: not enough weeks
Count the unknowns. For each channel, there are at least four (α, ec, slope, β). A business with ten channels has forty-odd numbers to find, before the baseline, trend and season.
Now count the data. Chan and Perry spell it out: a typical dataset of three years of national weekly data is only 156 data points. They note that modelling a lag and a diminishing return "might require 3 - 4 parameters for each channel", that a common rule of thumb for a stable regression is 7 to 10 data points per parameter, and that "typical MMMs fall short". With 20 channels at 3 to 4 parameters each, you would want somewhere around 400 to 800 weeks. That is between eight and fifteen years of weekly sales, during which the business, the market and the ads have all changed.3
Worse, the channels tend to move together. You run radio and search harder in December, when sales are high anyway. Chan and Perry show that when spend levels are correlated, two quite different sets of channel effects can fit the same history equally well. The data cannot tell them apart.
There are two fixes, and Meridian uses both.
Fix one: more rows, from regions
If Odette sells in six states, she has 156 weeks in each of six places, and her advertising differed between them. Meridian's data guide calls geo-level data the best practice. It recommends weekly data, suggests keeping to fewer than 20 channels, and gives a rule of thumb of at least two years of weekly data for a regional model and three years for a national one. The hierarchical model lets regions share what they learn, so a thin region borrows strength from the others.

Fix two: a sensible starting point (priors)
The second fix is why Meridian is Bayesian. The core idea is simple: start with a belief, look at the evidence, end with an updated belief. If a friend says she saw a platypus in the Derwent, you start somewhere between "plausible" and "she needs glasses", and the photo she shows you moves you one way or the other.
In an MMM, the starting belief is a prior: a range of values the model thinks are reasonable for, say, radio's return on investment (ROI), before it looks at Odette's data. Meridian describes a prior as "a starting point based on your information", and says the knowledge can come from "past experiments, past MMM results, industry expertise, or industry benchmarks". The default ROI prior is a log-normal distribution, a lopsided curve that allows only positive values, with a long tail for the occasional channel that performs well above the rest.
The model fits the data and gives back a posterior: the updated range of believable values for every parameter. It finds that range with Markov chain Monte Carlo (MCMC), which walks around the possible answers and spends more time in the ones that fit both the prior and the data. Where it spends its time becomes the probability.
This matters in your budget meeting. An MMM does not give you "radio ROI = 2.4". It gives you a range, a credible interval, for example "most likely between 1.1 and 3.9". When the data is thin, the range is wide, and, as the 2017 Google paper warns, the priors "have a big impact on the posteriors when the sample size is small". So an honest MMM report is partly a report about the priors. Ask to see them.
What an MMM cannot see
An MMM has its own blind spots, and they are the mirror image of attribution's.
- It has no detail and it is slow. It tells you about "paid search", not one keyword or last Tuesday, and it needs months of data to notice a change.
- It cannot see outside what you have done. If Odette has never spent more than $15,000 a month on radio, the model's curve above $15,000 is a guess. Meridian's own docs say that results based on extrapolation "should be interpreted with an appropriate level of caution".
- It suffers from the same selection bias. An MMM sees that search spend and sales rise together in December. Did search cause the sales, or did the demand cause both? Meridian's paid search guidance says perhaps the biggest challenge is that "advertisers often spend more on marketing when there is stronger demand", and that failing to control for Google Query Volume (GQV) "can lead to overestimation of the causal effect of paid search". The fix is to add Google Query Volume as a control. It helps. It does not make the problem go away.
That last point is where Meridian's documentation is most candid. It calls MMM "causal inference from observational data". The main assumption it needs, that the model's controls include every factor that drives both your spending and your sales, is one the docs call untestable. It then says "all models are wrong but some are useful", and warns that "a model with 99% out-of-sample R-squared can still be a poor model for causal inference". A model that fits your history perfectly can still give you the wrong answer to "what if". Attribution and MMM are both, in the end, careful ways of looking at what already happened. To find out what causes what, you have to change something on purpose.
Part 4: Experiments, the Referee Both Methods Need

You already know how to run one
If you want to know whether the new tea blend helps you sleep, you do not ask yourself each morning which cup deserves the credit. You drink it on some nights and not on others, and you compare. If you are strict about it, you let a coin decide which nights.
That is a randomised experiment. In advertising it is called an incrementality, lift or holdout test. Split people or places into two groups at random, show the ads to one group only, and the difference in sales is what the ads caused, because the ads are the only systematic difference between the groups. Chan and Perry call it "the generally accepted gold standard". The eBay study was one.
For most advertisers, the practical version is a geo experiment: pause (or increase) a channel in some regions and not others, then compare the regions. It is exactly what the painting above shows, minus the goat, which is decorative.4
Experiments show the other methods are off
When researchers compare experiments with the methods most of us use, the gap is not small. In 2019, Brett Gordon and colleagues compared 15 large advertising experiments at Facebook, covering 500 million user-experiment observations and 1.6 billion impressions, with the observational methods an advertiser would normally use. Those methods "often fail to produce the same effects as the randomized experiments", even after allowing for detailed demographic and behavioural data.
So why use anything else? Experiments are expensive and noisy. Randall Lewis and Justin Rao, then at Yahoo!, ran 25 large experiments for US retailers and brokerages, with $2.8 million of ad spend between them. The median confidence interval on return on investment was "over 100 percentage points wide". Individual sales jump around so much, relative to the cost of the ads, that an informative experiment "can easily require more than 10 million person-weeks". Their paper is called "The Unfavorable Economics of Measuring the Returns to Advertising", which is the most honest title in marketing science.5
And even a perfect experiment answers one question: this channel, at this spend, in these regions and weeks. Meridian's causal inference page makes the point in MMM's favour: an experiment "is typically designed to estimate one specific quantity", while an MMM can give an ROI for every channel and the full curves.
Calibration: using the referee's scorecard
The answer is to use both. Run an experiment on the channel you are least sure about, then feed the result into the MMM as a prior. Meridian calls this calibration: "When ROI experiment results are used to set channel-specific ROI priors, Meridian refers to this as calibration." The model then has to fit the data and agree reasonably with the experiment.
Google's docs add two cautions I would like more vendors to repeat. First, "there is no specific formula to translate an experiment result into a prior". Second, "the ROI measured by an experiment never aligns perfectly with the ROI measured by MMM", because the experiment measured one time window, one set of regions and one campaign setup. In statistics terms, they have different estimands: they measure slightly different things. So the experiment is strong evidence, not a number you paste in.
Expedia Group gives one example. In a Google-published customer story from April 2026, its data science lead says the team fed branded search data into Meridian as a sign of brand health, then "used Brand Lift studies to validate the trends", and ended up able to "increase our budget for brand marketing". It is a vendor story with no numbers: an example of the method, not proof of the result.
Google is also building its own referee. In the lead-up to Marketing Live, Gaurav Bhaya announced Meridian GeoX, an open-source geo experiment tool whose results feed into Meridian. As of May 2026 it is not out yet: the post says it "will begin testing later this year", and the GeoX page says "coming soon".
Which brings us back to what arrived on 20 May.
Part 5: What Google Announced, and What It Didn't
Meridian is not new. Google unveiled it in March 2024, according to PPC Land's timeline, and released it to everyone in January 2025, after "testing it with hundreds of brands globally", with "over 20 measurement partners" certified to run it. It is free code, but you need data, a data scientist and time. Bhaya's pre-event post admits that "Marketing Mix Models (MMMs) can be complex to run".
The 20 May announcement at Google Marketing Live moves Meridian into a product people already use. Google's post says "we're bringing Meridian … into Google Analytics 360. Soon, you'll be able to": bring first-party and cross-channel data together, "measure causal performance", and "use predictive scenarios to guide smarter investments". Search Engine Land reports that the integrations are coming to Analytics 360 "globally across all languages".
As of the end of May 2026, here is what is known and what is not.
- It is for Analytics 360, the paid enterprise tier. The free Google Analytics is not mentioned.
- There is no date. The word in Google's post is "soon". PPC Land notes that "no specific date" was given.
- It is a lighter version. Adswerve, which has spent a year building and deploying Meridian for clients, describes it as "structured reporting and light visualizations", and says it "should not be considered a replacement for a full Meridian build". Teams with custom data or deeper scenario work will still want the full version.
- There is a new input on the way. Google also announced Qualified Future Conversions (QFCs), a Gemini-powered Google Ads metric that uses signals like brand searches to predict later sales. Google says QFCs "will eventually integrate with Meridian". PPC Land points out the obvious risk: a Google-made prediction, built on Google Ads data, feeding a model that also judges Google Ads, "raises questions about circularity and what measurement professionals call prior contamination". Google, it notes, "has not published methodological documentation" for how that would work.
Watch the priors
Here is a detail that I think deserves more attention than it got. Some Google Analytics properties already have a budgeting tool, in beta, with a scenario planner. Its help page, as captured in March 2026, says it uses "your property's historical data driven attribution as the primary input to a Bayesian regression model". The model is "inspired by Google's Meridian", but "you should not expect consistency or reproducibility using Meridian due to Google Analytics use of Data-driven Attribution priors."
Read that with Part 2 in mind. That model's starting beliefs come from attribution, which gives away the whole sale and rewards targeting. A Bayesian model with limited data leans on its priors. So a model with attribution priors can end up agreeing with attribution, with more decimal places.
To be fair and precise: that page describes the existing beta, not the Meridian integration announced on 20 May. Google's announcement does not say what the new version will use as priors, or whether you will be able to set your own. That is the first question I would ask your Google account team, and the answer will tell you a lot about how independent the new numbers are.
None of this is a reason to ignore the feature. Adswerve's most useful line is that, in its client work, "having the model is rarely the bottleneck". The hard parts are clean data and getting people to act. A model next to the campaign reports could improve budget meetings a lot, if the people in them know what kind of number they are looking at.
Part 6: Odette Gets a Budget
Odette's cidery (still made up, although the Derwent Valley is real and the cider there is excellent) now sells online across Australia. Last year she spent about $120,000 on marketing:
- Google Ads brand search (people searching the cidery's name): $18,000
- Google Ads generic search ("craft cider", "Tasmanian cider gift"): $30,000
- Meta ads: $27,000
- YouTube: $15,000
- A sponsorship on a food podcast: $20,000
- Radio, the market stall and the highway sign: $10,000, give or take the sign
She has three years of weekly sales and spend by state, clean UTM tags (she read Mastering UTM Tags, naturally), and GA4 with data-driven attribution. Her accountant has asked four questions, and we will decide which tool gets which question.
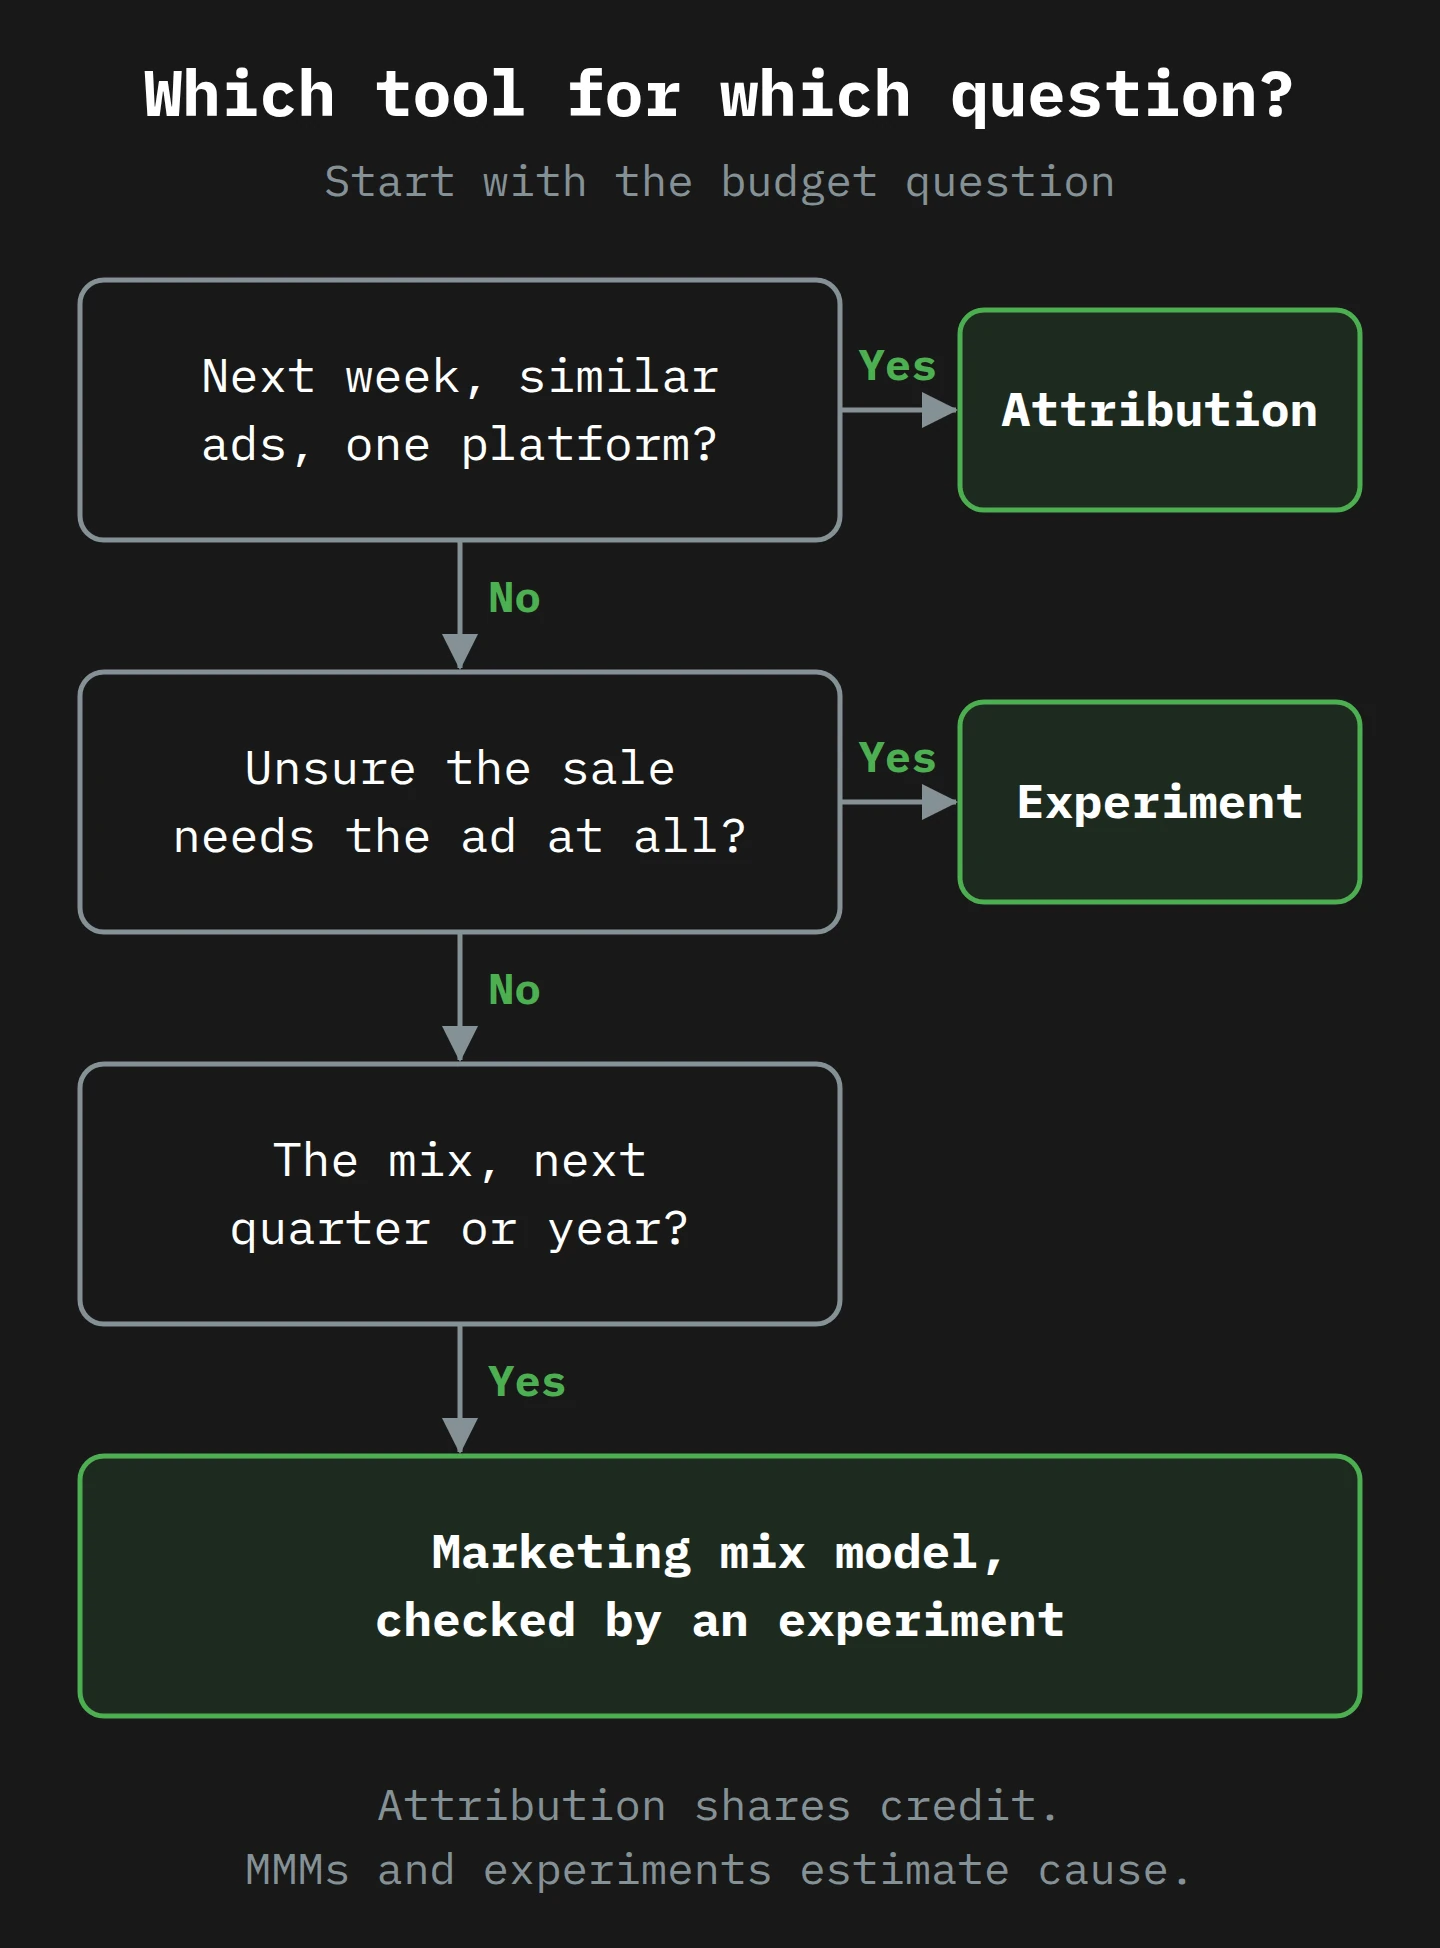
Question 1: "Which of the generic search ads should get the extra $20 a day?"
Tool: attribution (and the Google Ads reports). Similar ads, same channel, this week. They face the same kind of searcher, so the selection bias is roughly equal, and an MMM cannot see individual ads at all. Odette uses the GA4 reports and moves on.
Question 2: "Is brand search worth $18,000 a year?"
Tool: an experiment. Attribution will say brand search is her best channel: people who click a brand ad buy a lot. An MMM will struggle too, because brand search spend rises and falls with brand demand, which is the confounding problem Meridian's own paid search guide warns about. This is the eBay question, and only an experiment can answer it.
So Odette pauses brand search in two states for six weeks and keeps it on in the rest. She chooses the paused states before she looks at any results, and she compares total online sales (not ad-attributed sales) in the paused states against the rest and against the same weeks last year. She also checks whether a competitor is bidding on her name, because if one is, pausing may hand them her customers, and the experiment will show it.6
The result becomes a prior for question 3.
Question 3: "Should we move money from search to YouTube and the podcast next year?"
Tool: an MMM, calibrated with the experiment. This is a mix question, over a year, across channels that attribution sees unequally. The podcast and YouTube rarely produce a click, so attribution gives them almost nothing. The MMM can see whether the weeks and states with more podcast and YouTube spend had more total sales than the baseline and the season explain.
Three years of weekly data in six states meets Meridian's rule of thumb for a regional model, and six channels is well under twenty. But her spend is small, and Lewis and Rao showed how noisy advertising effects are even with far more data. So she should expect wide credible intervals, and read them as the answer, not as noise around it. "YouTube's ROI is between 0.6 and 2.8" means "we do not know yet whether YouTube pays for itself". That is useful to know. It means YouTube is the next candidate for an experiment.
Odette does not have Analytics 360, so her choice is a Meridian partner, a freelancer who knows Meridian or Robyn, or a very long weekend. For a business with Analytics 360, the built-in version may be the fastest first model, if someone asks what priors it uses.
Question 4: "What would happen if we doubled the budget?"
Tool: the MMM, with a warning label. The response curves answer this directly. But Odette has never spent $240,000, so every point on the curve beyond her past spending is extrapolation. The safe step is to double one channel in a few states first and see whether the curve holds.
The pattern
Attribution got the quick, narrow question. The MMM got the big mix question. The experiment got the question neither can answer, and its result went into the MMM. No tool won. Each question went to the tool that measures what it asks.
What to Do This Week
- Write down your next three budget questions. For each, decide whether it is about credit (who gets it for sales that happened) or cause (what changes if we spend differently). Only credit questions belong to the attribution report.
- Check your attribution settings. In GA4, go to Admin, then under Data display click Events, then Attribution settings. Note the reporting model and the lookback window. Anyone who quotes channel numbers should know both.
- Find your brand search share. In Google Ads, split brand and generic campaigns if they are mixed. If brand campaigns take a large share of the credit, put a brand search experiment on the list.
- Take stock of your MMM data. You need weekly spend by channel (including the offline channels), weekly sales (from your finance system, not the ad platforms), and ideally both by region, for at least two years. Keep a list of known events: price changes, promotions, outages, stock shortages. If you cannot put this spreadsheet together, that is your first project, whatever model you use later.
- Choose one channel for an experiment. Pick the channel where the attribution and your instinct disagree most, and plan a geo test: which regions, how long, and which total sales figure you will compare. Decide all of this before you start.
- If you have Analytics 360, ask your Google team three things about the Meridian integration: which channels and data it will use, what priors it starts from (and whether they come from attribution), and whether you can set your own priors from experiments.
- Change how you report. Show MMM results as ranges, not single numbers. Label every channel figure with the method that produced it: "attributed", "modelled" or "tested".
Final Thoughts
Back at the cidery, the sign on the highway still gets 61% of the answers at the till. The answer is true. The sign really was the last thing most customers saw. It is just the answer to "who got them to the door?", and Odette had been using it to answer "where should the money go?"
That is the takeaway. Attribution shares credit for the sales you got. A marketing mix model estimates what your spending caused, allowing for the sales that would have come anyway. An experiment checks both. As of May 2026, Google is putting an MMM into Analytics 360, so many teams will soon see both numbers side by side, disagreeing. That is two tools answering two different questions.
So this week, write down your next budget question and decide which tool it belongs to. If it is about the mix, start on the weekly spreadsheet. If it is about a channel you suspect, plan the experiment.
As for Odette, she has put the radio ad back on and kept the sign. The sign cost $300, and it does a fine job of pointing at the turn-off. Now, if you'll excuse me, my tea is ready, and I'd like to give it full credit for this article. It was the last thing I touched.
Notes
-
A key event is Google Analytics 4's name for an event you have marked as important, such as a purchase or a sign-up. Google Analytics used to call these conversions, and Google Ads still does. ↩
-
The eBay study also tested non-brand keywords, by stopping them in about 30% of eBay's US traffic. Ads helped new and infrequent users, but most of the spend went on frequent users who would have bought anyway, and the authors calculated average returns that were negative. The paper was later published in Econometrica, in 2015. ↩
-
Twenty channels at 3 to 4 parameters each is 60 to 80 parameters. At 7 to 10 data points per parameter, that is 420 to 800 weekly observations, before trend, season and controls. This is my arithmetic from Chan and Perry's figures, not a number from their paper. ↩
-
Goats do not affect advertising experiments, to my knowledge. The ones down the road would like to be considered for a future study. ↩
-
Earlier versions of the Lewis and Rao paper circulated under the title "On the Near Impossibility of Measuring the Returns to Advertising". The journal version is slightly more hopeful, and it still argues that randomised trials are progress, because they add new, unbiased information. ↩
-
A brand search pause is safest when nobody else bids on your name, when you rank first in the free results, and when you can compare total sales, not clicks alone. If competitors bid on your name, the test measures how much of your traffic they take when you step aside, which is also worth knowing. ↩