If you’ve been using Google’s Universal Analytics for tracking your site traffic and user behavior, you’ve probably heard the news by now: Universal Analytics will stop collecting new data on the July 1, 2023, and will be completely shut down a year later (July 1, 2024). That’s right, time to say goodbye to that old friend and start packing your data bags.
Now, like many people, you might be thinking, “why would Google do this to us? We’ve been using Universal Analytics for years”! Well, my fellow data enthusiast, there are a number of reasons, but for simplicity, lets chalk it up to ‘progress’. Google Analytics 4 is the new kid on the block, promising a more intelligent, future-proof solution for businesses to understand customer behavior. It’s all very exciting, but it also means we have to say goodbye to the older version.
But what about all the data you have collected in your Universal Analytics account? How do you prevent the loss of this critical business intelligence? Let’s take a look at our options and plot and get things rolling in the right direction for you and your data.
It’s Moving Time
Before you panic and start wondering how to salvage years of your hard-earned data, take a deep breath. Yes, Universal Analytics is retiring, but it’s not pulling a magic trick and disappearing into thin air. All your data is still accessible, and you have until July 1, 2024, to export it.
With that said, you need to make some decisions about how you actually will be exporting, warehousing, and orchestrating (into reports) this data, so don’t wait too long. By the same token, there is no huge benefit in exporting your data before the July 1st, 2023 data cessation deadline because you will have to hydrate your warehouse with fresh data over and over again.
Think of it like a nice hot cup of tea: if drink it too soon after you pour it, you might burn yourself, and if you wait too long it will either be iced tea, or may have completely evaporated. So, my recommendation is to start planning now and get your solution in action as soon as possible after the cutoff period.
Before we talk about what to export, let’s talk about your export and warehousing options, as this make govern how much data you export and how you use it. In an ideal world, your data consumption scheme (i.e. how you report and the kinds of insights you need to make effective decisions) would be the deciding factor, but in reality, there are factors like accessibility of the data, costs, and resource constraints to export the data at the scale you might want.
Even though migrating your data isn’t an option, saving it is – and trust me – a breeze if you know what you’re doing. While the GA360 (Google’s premium product) offers an easy export of Universal Analytics data to BigQuery, its price tag can deter smaller organizations. As such, these recommendations are focused on Standard Analytics users. Alright, without further delay, let’s get into the juicy stuff.
The Manual Method
Let’s start with the simplest of methods – Manual Export. Think of it as the good old screwdriver in your data warehousing toolkit. It might not be the most advanced tool in the box, but it gets the job done efficiently, especially when you’re dealing with smaller sets of data.
To use this method, you go straight to your Google Analytics account, navigate to the report you wish to export, and adjust it to your liking. Whether you want to focus on a specific country, filter for a particular page grouping, or apply a secondary dimension for landing pages, this is your chance to make the data your own.
Once you’re satisfied, all you have to do is click on the ‘EXPORT’ button on the top right, choose your preferred file format, and voila – you have your historical data at your fingertips. Simple, straightforward, and not a single line of code in sight.
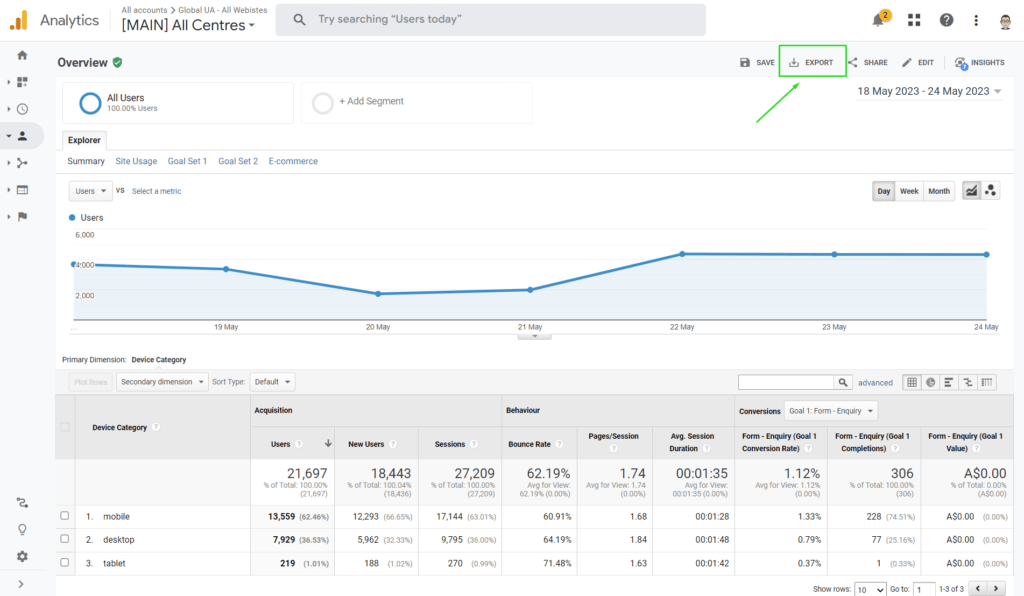
However, simplicity does come with its limitations. With the manual method, you’re restricted to two dimensions and a maximum of 5,000 rows. If your website is a traffic magnet attracting thousands of hits per day, your data might end up being sampled. To ensure your data’s accuracy, make sure to look for the green checkmark shield near the report’s title, which tells you that your data is not sampled.
Pros:
- Easy and straightforward.
- No need for additional tools or software.
Cons:
- Limited to two dimensions and a maximum of 5,000 rows.
- Data might be sampled, reducing its accuracy.
Analytics Dev Tools: Query Explorer
If you’re ready to take a step further into the tech realm, the Query Explorer in Google Analytics Dev Tools is your next stop. Don’t worry if the term “dev tools” feels intimidating – chances are, you’re already familiar with one of them if you’ve ever used the Campaign URL Builder to create UTM parameters for campaigns.
With the Query Explorer, you can be more flexible with your data export. Open the tool, sign into your Google Analytics account, select the account, property, and view you wish to save data for, and you’re good to go.
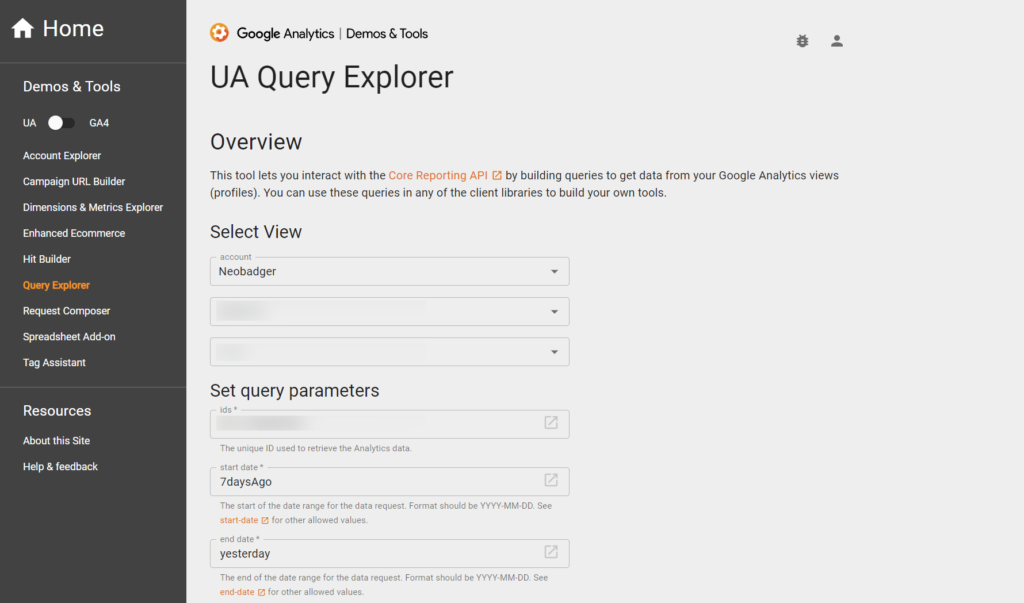
The Query Explorer allows you to set a variety of query parameters, such as date range, metrics, dimensions, and any filters or segments you’d like to apply. You can choose every metric in the report you want to replicate or select specific metrics that align with your goals. Once you’re happy with your settings, run the query, download the data, and open it in Excel or Google Sheets.
However, like the manual method, this one isn’t without its limitations. If you’re looking to visualize your data in Google Data Studio, you’ll need to set your dimensions separately, adding an extra step to the process.
Pros:
- Greater flexibility: The Query Explorer offers a wider range of parameters and filters, giving you more control over your data.
- Free: Like the manual method, this option doesn’t require any additional cost, making it a great choice for smaller budgets.
Cons:
- Technical knowledge required: While it’s not overly complex, you’ll need some basic tech know-how to navigate the Query Explorer effectively.
- Extra steps for Data Studio visualization: If you want to visualize your data, be prepared to go through some additional steps.
Google Analytics Sheets Add-On
If you’re looking for something that marries the simplicity of the manual method with the flexibility of the Query Explorer, then the Google Analytics Sheets Add-On is your perfect match.
This method takes away the hassle of downloading and uploading data by connecting Google Analytics directly to Google Sheets. Simply create a new Google Sheet, install the Google Analytics app from the Google Workspace Marketplace, and create a new report in the app.
As you set up your report, you can select your preferred metrics, dimensions, and segments, and even apply filters. Once everything’s ready, run the report to export your data directly to the sheet.
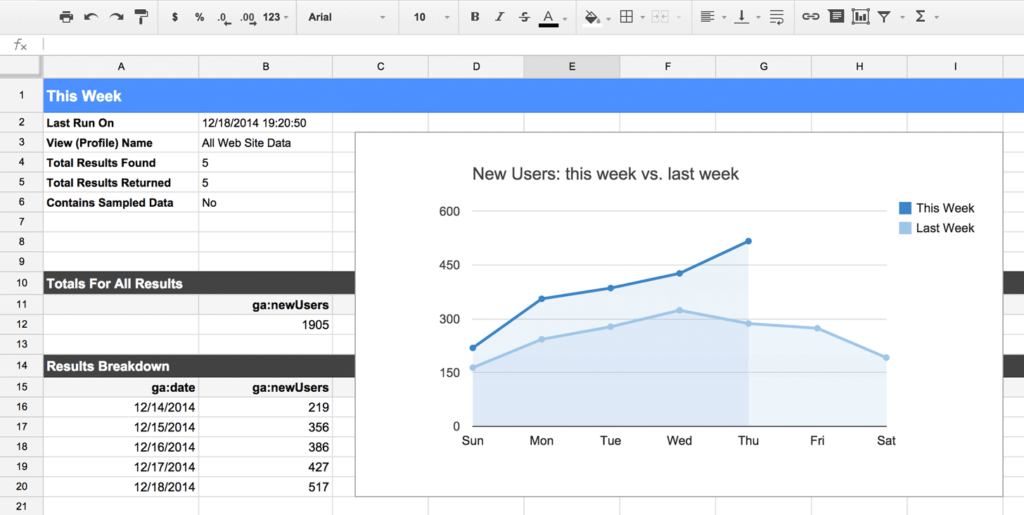
However, be aware that this method can be time-consuming, especially if you’re running multiple reports. Moreover, if your data exceeds 500,000 sessions within the timeframe, it may be sampled, affecting the accuracy of your data.
Pros:
- Direct connection: This method eliminates the intermediary, exporting your data directly to Google Sheets.
- Customizable: Like the Query Explorer, the Google Sheets Add-On allows for a high level of customization.
Cons:
- Time-consuming: Setting up and running reports can be a slow process, especially if you’re dealing with large amounts of data.
- Potential for data sampling: Like the manual method, your data may be sampled if it exceeds a certain amount.
Third-Party Tools: Going Pro
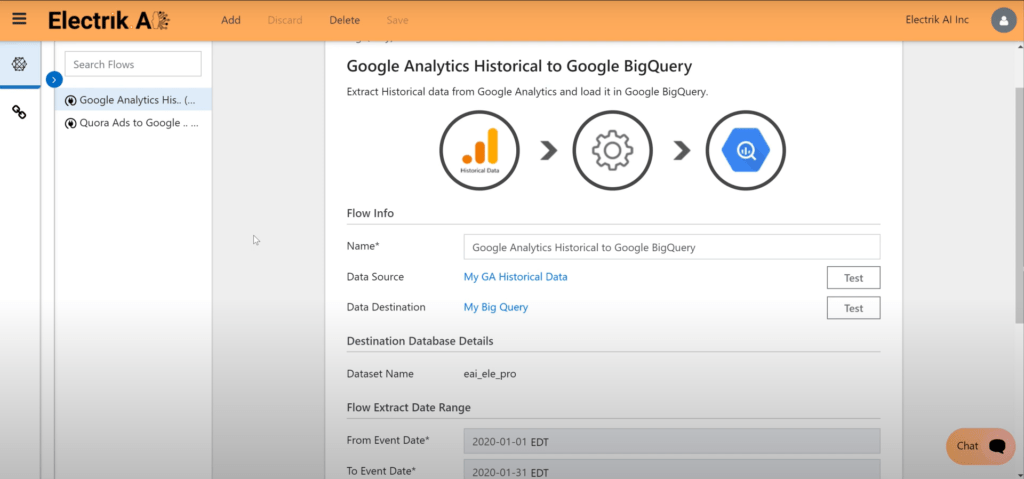
Third-party tools such as Supermetrics, OWOX, Electrik AI, and googleAnalyticsR can offer a more sophisticated approach to data extraction and analysis. These tools are built to handle large datasets efficiently and offer features that go beyond Google Analytics’ built-in capabilities.
One of their key advantages is their capacity to handle larger datasets. They also offer comprehensive integration with a variety of platforms, not just Google’s suite. This can result in a more seamless workflow if you’re juggling data from multiple sources. Additionally, many of these tools provide advanced features such as automated data exporting, customizable reporting, and enhanced data visualization tools.
However, these benefits come at a cost. Not only do third-party tools often carry a price tag, but they also require a degree of technical knowledge to use effectively. There’s a learning curve associated with them, and relying on them too heavily can lead to a dependency that could be problematic if the tool is no longer supported or if the company providing it goes out of business.
Pros:
- Large data handling: Third-party tools are built to handle much larger datasets than Google Analytics’ built-in features.
- Integration capabilities: These tools often provide integration with a variety of platforms, providing a more seamless workflow.
- Advanced features: Third-party tools often offer additional features like automated data exporting, customizable reporting, and advanced data visualization tools.
Cons:
- Cost: Third-party tools often come with a price tag, which can be a significant consideration for smaller businesses or those on a tight budget.
- Learning curve: While these tools offer advanced capabilities, they require a degree of technical knowledge to use effectively.
- Dependency: Relying on a third-party tool can create a dependency that could lead to disruptions if the tool is no longer supported or if the company providing it goes out of business.
Each of these methods has its own strengths and weaknesses, so the best choice really depends on your specific needs, budget, and technical capabilities. Just remember, in the realm of data, quality always trumps quantity. It’s more beneficial to be selective and focus on what’s really important, rather than trying to cover everything “just in case”. Be strategic, make wise choices, and let your data guide you to insights and decisions that will take your analytics to new heights.
Choosing the Right Method for Exporting Google Analytics Historical Data
So, we have at our disposal four distinct methods and an apple cart of third-party tools to export historical data from Google Analytics. But you might wonder, which one fits your bill? Choosing the right method is a crucial step, and to help you make an informed decision, let’s dive deeper into these parameters: cost, accessibility, learning curve, data volume, and the principle of quality over quantity.
Cost: Considering Your Budget
Money does matter. If you’re working on a shoestring budget, the manual method, and the Google Analytics Dev Tools: Query Explorer, are your knights in shining armor as they’re completely free. The Google Analytics Sheets Add-On is also a no-cost solution, but do keep in mind, you might need a Google Workspace account if you plan to store lots of data, which is chargeable.
On the other hand, third-party tools and paid Analytics providers do carry a price tag. However, they often bring to the table more advanced features that could very well justify the investment, especially for larger organizations. It’s also important to consider the ‘soft costs’ if your solution; if you opt for a ‘free’ solution, you might find the monetary savings are quickly undone by the manual nature of the solution.
Accessibility: Seamless Integration is Key
This dimension is all about the ease of integration of the method with your existing platforms and workflows. If you’ve placed your bets on Google products, the manual method, Query Explorer, and Sheets Add-On are potentially a perfect fit as they integrate seamlessly with Google’s suite.
But here’s a twist. If your data analysis takes you beyond Google platforms, you might find third-party tools to be your go-to choice. These tools are generally built to offer wider integration capabilities, thus offering more convenience. Perhaps now is a good time to think more broadly about your data warehousing approach in case any of your other sources decided to do a Google and delete your data, and a paid solution might pay off in the long run.
Learning Curve: From Tech Newbies to Wizards
Your comfort level with technology is a significant determinant of the method you pick. For the uninitiated or those still finding their footing in the world of Google Analytics, the manual method is a safe and easy starting point.
Query Explorer does demand a notch higher technical knowledge but is quite manageable once you get the hang of it. If you’re a Google Sheets whizz, the Sheets Add-On might be right up your alley despite its slightly more complex setup.
Third-party tools or paid Analytics providers, on the other hand, generally have a steeper learning curve. So, while they offer advanced functionalities, you need to weigh in the time and resources required for training.
Data Volume: From Kilobytes to Terabytes
The volume of data you plan to export is a critical factor to consider. The manual method, despite its simplicity, is limited to 5,000 rows. Therefore, it’s better suited for smaller datasets.
The Query Explorer and the Sheets Add-On are built to handle more significant volumes. But if you’re wrestling with colossal datasets and need the full data gamut, third-party tools and paid providers could be your savior, helping you avoid data sampling issues.
Final Thoughts
Ultimately, the method you choose for exporting your Google Analytics historical data depends on your specific needs and technical capabilities. The manual method is perfect if you need quick, simple data exports. If you’re comfortable getting your hands a bit dirty with tech and want more flexibility, Query Explorer is a great choice. On the other hand, if you want a direct link between Google Analytics and Google Sheets and are prepared to handle a bit more complexity, the Google Analytics Sheets Add-On is your friend.

In case you need to handle large datasets and avoid data sampling, you might want to consider third-party tools or paid Analytics providers. They might cost a bit, but they make up for it with enhanced features and capabilities. Remember, whichever method you choose, the critical point is to make use of this historical data. It’s a goldmine of insights that can help drive your decisions, spot trends, and ultimately, contribute to your growth. So, get exporting, y’all!