If you’ve got a website, odds are you’re started using Google Analytics 4 (GA4) to keep tabs on traffic, engagement, and all the fun stuff that GA4 lets you track. But have you ever heard of data sampling in GA4? Trust me, this is one topic you can’t afford to ignore. So, sit tight because we’re about to uncover everything you need to know about data sampling in GA4, no fluff involved.
Data sampling, you might ask? Why should you care? Excellent question! This seemingly mundane topic is actually crucial when it comes to analyzing your website’s metrics. If you’re looking at large volumes of data—and let’s face it, that’s practically a given these days—then understanding data sampling is a must.
Before we get started, you might also be here because your data is impacted by Thresholding. If this is the case (or you just want to learn that this is), take a look at this article.
What is Data Sampling in GA4?
So, what exactly is data sampling? Simply put, it’s a method GA4 employs to give you a quicker but approximate view of your website’s data. Think of it as a snapshot, not the whole album. Data sampling is particularly useful when you’re dealing with large data sets. But remember, the key word here is “approximate.” The goal is to save computational time and resources, so GA4 will only look at a portion of the data and extrapolate the rest.
Why does Google even bother with data sampling? Well, they’ve got to balance server load and report generation time. With the amount of data flowing through GA4, running full queries for each and every user would be like trying to fill a swimming pool with a garden hose—it’s just not practical.

Data sampling is the compromise between speed and detail. In most cases, the sampled data should give you a reasonable estimate of your actual numbers. But remember, it’s not perfect. If your website is hitting the big leagues with millions of visitors, even a small sampling error can mean big changes in how you interpret your data.
So, the takeaway is this: Data sampling is convenient, but it’s not the be-all and end-all. If you want a crystal-clear picture, you’ll need to understand its limitations and know when to dig deeper.
Sampled vs Unsampled Data: What You Need to Know
Sampled data and unsampled data are like the difference between taking an apple with you as you run out the front door to try and catch the bus, vs a full sit-down meal with tea ceremony attached. Both serve a purpose, but they offer different levels of depth and satisfaction. Sampled data is quick and easy, but it doesn’t capture every nuance. Unsampled data takes longer to process but gives you the complete picture.
So, when should you use each? Sampled data is great for quick overviews or for metrics that don’t require pinpoint accuracy; things like getting a feel for the impact of a given UI update on your KPIs. But if you’re diving into specific details—like fine-tuning your marketing strategy—you’ll want the full unsampled data to make informed decisions.
Remember, using sampled data for high-stakes analysis can be risky. You’re essentially making educated guesses, which isn’t always good enough when you’re dealing with significant business decisions.
Which Reports in GA4 Get Sampled?
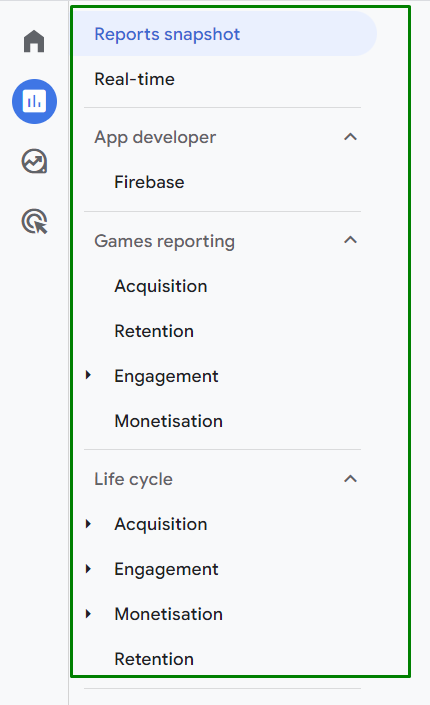
In GA4, there are two primary types of reports—standard and advanced. Standard reports (sometimes referred to as Aggregate reports) are your regular, everyday metrics. You’re likely to encounter these when you first open GA4, and these generally use unsampled data (but sometimes the data is sampled):

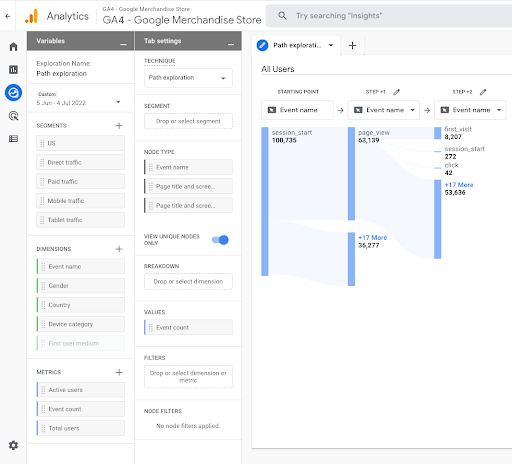
But hold on a second—what about advanced reports? Now that’s where the real magic happens, but also where you’ll most likely bump into data sampling. Advanced reports involve more complicated queries and deeper analysis, which could mean higher computational demands. Google tries to save its servers from turning into a bonfire, so it uses sampled data for these more complex reports.

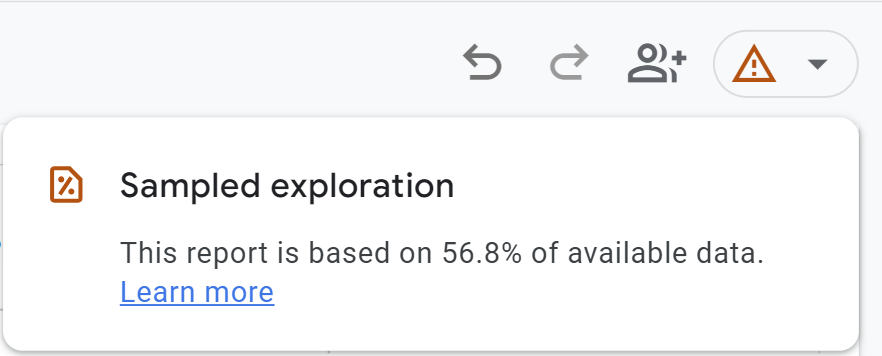
Now, you might wonder, how do you even know if your data is being sampled? GA4 is pretty upfront about it. You should see a small icon somewhere on your report interface, like a yellow triangle or a warning sign. This isn’t just for show; it’s there to say, “Hey, you might want to double-check this before making any major decisions.” Don’t just skim past these icons; they’re like road signs indicating if you’re on the ‘approximation highway’ or the ‘accuracy autobahn.’

Why does this matter? Because the type of report you’re using shapes the reliability of your data. If you’re using advanced reports to break down customer segments, run complex filters, or analyze long-term trends, you better be aware that sampled data might not cut it. You may need to cross-reference with other data points, or better yet, try to obtain unsampled data through other means.
Three Big Gotchas with Data Sampling
Before you skip to the end, let’s get serious for a moment. Data sampling in GA4 isn’t all sunshine and rainbows. Here are the pitfalls you need to dodge:
Less Data = Less Clarity
First off, let’s talk about the elephant in the room: the reduced volume of data. You can’t make a gourmet meal with half the ingredients, and similarly, less data seriously degrades your ability to understand your website’s performance thoroughly. Limited data means GA4 can’t give you those nitty-gritty, granular insights that you often need to optimize campaigns or understand user behavior in-depth. In essence, data sampling turns your analytics into a broad stroke painting rather than a finely detailed masterpiece.
Approximations Aren’t Certainties
The second pitfall comes from the realm of “estimated results”. Estimates are fine if you’re making a fresh batch of scones to go with your Lady Grey tea, but not so much for understanding your website’s metrics. Because you’re working with a subset of your total data, the figures you get are approximations. So, while these numbers might give you a general idea of trends, they aren’t gospel. Making decisions based on approximated data is like building a house on a shaky foundation.
The Sampling Gap: The Data You Never Saw
Then we have the ‘sampling gap,’ the hidden pitfall that trips up even the best of us. Because sampled data is a limited subset of your total data pool, there are portions of your user base that you’re essentially ignoring. It’s like throwing a party and only inviting half your friends; you’re missing out on the full experience. This gap can especially distort performance metrics if the omitted data includes significant trends or outliers. Think of it as the analytics version of an optical illusion: what you see is not always what you get.
Beat the System: Avoid Data Sampling
Alright, we’ve laid out the pitfalls of data sampling; it’s like a minefield out there. But here’s the deal: it’s not game over. There are strategies you can employ to sidestep these traps and gather more accurate data. Let’s get you geared up with the best practices and tools to avoid or minimize data sampling in Google Analytics 4.
Fine-Tune the Date Range
One quick fix? The date range. Yes, you heard me, keep your data range tight, and you can generally avoid hitting those sampling thresholds. It’s like narrowing the focus of a camera to get a clearer picture. If you have a small-time frame, Google Analytics 4 won’t need to pull a sample; it can look at all the data. For more in-depth research, you can run multiple tight-ranged reports and then piece them together like a jigsaw puzzle. Sure, it’s a bit of a workaround, but sometimes you get what you get, and you can’t get upset.
Traffic Volume: Finding the Sweet Spot
If your website is new or not attracting much traffic, you could run into the opposite problem—sampling due to low data volume. You need a good amount of data to make any meaningful analysis. So, aim for that sweet spot where your site is generating enough traffic to provide useful analytics but not so much that you hit GA4’s sampling thresholds. Easier said than done, I know, but good SEO practices, consistent content updates, and targeted advertising can get you there.
The Magic of Low-Cardinality Dimensions
Another way to sidestep the sampling quicksand is by being smart about the dimensions you apply in your reports. Use fewer segments and pick low-cardinality dimensions—that’s geek speak for dimensions that don’t have a ton of unique values. The fewer unique values, the less processing Google Analytics has to do, thus reducing the likelihood of sampling. It’s a bit like sorting M&Ms by color instead of figuring out which ones came from which factory. Less detailed? Maybe. Easier? Absolutely.
Employ Third-Party Tools: The Data Reinforcements
If you’ve tried all of these and still find yourself stuck in sampling purgatory, there’s another route: third-party tools. Services like BigQuery can collect unsampled data directly and store it for your analytical needs. Think of it as calling in the reinforcements when you’re outnumbered. It’s an extra step, but if you’re serious about data accuracy, this can be a game-changer.
Final Thoughts
Alright, let’s wrap this up. We’ve journeyed through the ins and outs of Google Analytics 4, dissecting what data sampling is and why it exists. We’ve also examined the difference between sampled and unsampled data and ventured into the potential drawbacks that can throw a wrench in your data-driven strategies. But here’s the good news: you’re not powerless against the sampling monster.
You’ve got options; whether it’s fine-tuning your date range, picking the right dimensions, or even calling in third-party heavy hitters like BigQuery, there are multiple pathways to cleaner, more reliable data. Remember, knowledge is power. Now that you’re equipped with the tools and tips to navigate this landscape, you can proceed with more confidence.
Happy data hunting, and may your analytics be ever in your favor!

